❌

Reading view

City Racial Segregation Stats Resist Aggregation Bias

Residential segregation remains one of the most pressing and persistent challenges facing American cities today. It fractures economic opportunity, stifles social cohesion, and underpins many of the inequities visible across urban landscapes. Despite decades of research into the patterns and consequences of segregation, the measurement of these patterns has long grappled with a thorny methodological problem: how the artificial boundaries used to aggregate population data influence estimates of segregation. This problem, often called the modifiable areal unit problem (MAUP), arises because segregation indices depend critically on how spatial units—like Census tracts—are defined and aggregated. Until now, a comprehensive assessment of this source of variability has remained out of reach.

In a groundbreaking study published in Nature Cities, researchers have employed an innovative approach that leverages redistricting algorithms to simulate millions of alternative spatial boundary configurations. These alternative maps adhere to official Census criteria but shuffle tract boundaries within those parameters, creating an unprecedented way to probe how sensitive traditional segregation indices are to the arbitrary boundaries that political and statistical geographies impose. The results challenge established assumptions and ultimately affirm the practicality—and peculiar robustness—of Census tracts as tools for racial segregation measurement across U.S. cities.

Traditionally, segregation research relies on fixed geographic units, most commonly Census tracts, to evaluate how populations of different racial and ethnic groups are distributed across cities. But these tracts, while designed to be relatively homogeneous and stable, are shaped by administrative decisions that do not directly correspond to natural or social boundaries. Since the exact delineation of these tracts can stray substantially, estimates of segregation derived from them have always carried a hidden risk of aggregation bias. Sensitivity analyses that explore alternate aggregations have been limited in scope, relying on hypothetical adjustments or crude spatial aggregations, rather than systematically exploring the vast universe of plausible boundary alternatives.

The new study breaks this impasse by borrowing tools from political redistricting theory—where map-drawing is a highly contested and technically advanced field. The researchers developed a computational framework using redistricting software capable of generating millions of alternate Census tract configurations within each city. These alternative configurations satisfy Census Bureau guidelines on population equality and contiguity, approximating what feasible boundary revisions might realistically look like. By calculating segregation indices for each configuration, the team was able to characterize the full probabilistic distribution of segregation estimates that arise purely from boundary variability.

Their analysis covered a wide range of U.S. cities, from smaller metropolitan areas with relatively few tracts to sprawling urban agglomerations comprising thousands of tracts. The findings reveal a striking pattern: in smaller cities, the estimated levels of racial segregation can fluctuate substantially when alternative boundary maps are considered. This variability highlights the dangers of over-reliance on fixed census geographies in contexts where granularity is limited and aggregation artifacts become significant. In contrast, as city size grows and spatial units multiply, the observed segregation estimates converge; the impact of redrawing boundaries diminishes, and estimates become more stable and trustworthy.

Perhaps more surprisingly, the study found no evidence that existing Census tract-based estimates are systematically biased in either direction. The official tract boundary estimates tended to fall near the mean of the simulated distribution of alternative boundaries. This outcome challenges the often-expressed concern that Census tracts might drastically overstate or understate segregation. Instead, while individual estimates do carry inherent spatial aggregation uncertainty, the conventional measures are, on average, representative. This nuance adds an important layer of confidence to decades of segregation research relying on these geographic units.

Technically, the probabilistic distributions generated by the redistricting simulations provide a novel way to frame segregation statistics in an uncertainty framework. Instead of presenting segregation as a point estimate, urban researchers and policymakers can now appreciate a spectrum of plausible segregation values conditioned on boundary choices. This opens avenues for more transparent reporting that reflects the inherent spatial ambiguity in aggregate data analysis, empowering better-informed decisions on interventions aimed at mitigating segregation and its effects.

The methodology itself is noteworthy for blending urban demographics with advanced computational geography. By applying constraints like population equivalence and spatial contiguity, the simulations closely mimic the federal redistricting process and ensure that the alternative boundaries are grounded in realistic criteria rather than purely theoretical constructs. This rigor elevates the findings beyond mere sensitivity checks, framing boundary uncertainty as a quantifiable dimension of segregation research rather than a theoretical limitation.

These insights carry significant implications not only for researchers but also for policymakers and activists engaged in urban planning, housing, and civil rights advocacy. Recognizing that reported segregation metrics come with an intrinsic range of variance caused by how boundaries are drawn can lead to greater caution in interpreting city rankings or trends over time. More fundamentally, it signals the need for complementary approaches that integrate non-aggregate data sources or spatially continuous methods to further refine segregation measurement.

The study also presents a generalizable framework adaptable to other domains where spatial aggregation introduces bias and uncertainty. Fields such as public health, environmental justice, and economic geography often rely on aggregated spatial data vulnerable to the MAUP. The redistricting simulation approach offers a powerful template for diagnosing and statistically correcting aggregation error in these varied contexts, paving the way for more robust spatial analyses across disciplines.

One of the most profound contributions of this research is its nuanced vindication of the Census tract as a unit of analysis. While researchers have long critiqued the arbitrariness inherent in fixed administrative boundaries, the study’s results demonstrate that in many urban contexts at scale, these units provide a sufficiently stable foundation for measuring segregation. This balancing of skepticism with empirical validation is rare in social science and signals a promising path toward methodological refinement rather than wholesale rejection of conventional metrics.

The findings also underscore the importance of city size and spatial scale in segregation measurement. Smaller cities, where the number of spatial units is limited, experience much greater volatility in segregation estimates. This volatility arises because each tract, or aggregation unit, represents a larger proportional share of the city’s population, amplifying boundary effects. Larger cities benefit from statistical smoothing through numerous smaller units, increasing estimate robustness. This insight could deeply inform urban comparative studies and the design of equitable zoning or integration policies tailored to city scale.

Going forward, the authors advocate for broad adoption and further development of their redistricting simulation platform. Enhancing the tool’s accessibility and integrating it with standard segregation calculations could democratize this approach, allowing urban researchers everywhere to rigorously address aggregation bias. Moreover, expanding simulations to explore additional boundary constraints or to incorporate social network data could refine understanding of how human geography and administrative geography intersect to shape segregation patterns.

The study arrives at a critical moment, as U.S. cities grapple with evolving demographic realities amid ongoing debates over race, equality, and urban policy. Precise and reliable measurement tools are foundational to both academic inquiry and effective governance. By making segregation measurement more transparent and statistically nuanced, this research provides a critical step towards evidence-based urban reform that acknowledges complexity without being paralyzed by it.

In conclusion, this pioneering study reframes the measurement of racial segregation by exposing the variability introduced through spatial aggregation while reassuring researchers and policymakers of the general reliability of established Census tract definitions. By harnessing computational redistricting techniques, it both deepens and democratizes understanding of urban racial geography, offering a blueprint for more rigorous and nuanced measurement in this socially consequential domain. The framework not only enriches segregation studies but sets a new standard for spatial data analysis in the social sciences, inviting an era where measurement uncertainty is openly acknowledged and expertly managed.

Subject of Research:
City-scale racial segregation measurement and spatial aggregation bias in U.S. metropolitan areas.

Article Title:
City racial segregation statistics are robust to aggregation bias.

Article References:
Brown, J.R., Kenny, C.T. & Simko, T. City racial segregation statistics are robust to aggregation bias. Nat Cities (2026). https://doi.org/10.1038/s44284-026-00459-3

Image Credits:
AI Generated

DOI:
https://doi.org/10.1038/s44284-026-00459-3

  •  

Quest for Fire: New Technique Pushes First Intentional Use of Fire to Over One Million Years Ago


An international team of researchers led by Dr. Liora Kolska Horwitz of the Hebrew University of Jerusalem’s National Natural History Collections, working at the site of the oldest dated intentional use of fire by ancient human ancestors, South Africa’s Wonderwerk Cave, has found new evidence pushing that date even earlier into prehistory.

The research team behind the potentially history-altering findings said the discovery, which suggests that ancient hominins intentionally controlled fire, resulting in charred animal bones sometime between 1.07 and 1.79 million years ago, provides researchers with previously unavailable insights into how our ancestors first began to harness one of the most important tools in the evolution of human society and culture.

The study also introduced the archaeological community to a promising new method for analyzing burned bone samples by monitoring its light-emitting properties.

Intentional Use of Fire Provided Human Ancestors with a Critical Tool

According to a statement announcing the study, Dr. Horwitz, who is co-director of the Wonderwerk Cave project with Prof. Michael Chazan at the University of Toronto, and colleagues note the historical significance of fire, ranging from warmth and predator protection to extended daylight and the cooking of meat. However, historians have struggled to identify a single moment or historical period where humanity’s ancient ancestors first started to use fire intentionally.

“Evidence of fire from such ancient sites is often subtle and difficult to detect,” Dr. Horwitz explained.

Before the new analysis, the oldest agreed-upon evidence for intentional fire use also came from Wonderwerk Cave. Situated within the Kalahari Desert of South Africa, the cave provided evidence placing fire use to approximately 1 million years ago.

first intentional use of fire
Wonderwerk Cave Entrance. Image Credit: Wonderwerk Cave Project.

While that study used the most advanced techniques available, the team behind the new study decided to employ a non-invasive process that involves illuminating ancient bone fragments with specific wavelengths of light to determine whether they had been exposed to intense heat. In cases where bones have been heated to fire-like temperatures, the right wavelength of light will cause them to glow.

Remains Likely Left by Homo Erectus

Because evidence from ancient sites is scarce, the team’s non-invasive technique allowed them to study tiny fossilized rodent bones left in the cave by owls without damaging them. The team noted that using remains that accumulated naturally on the ancient cave floor provides an “independent, non-anthropogenic record” of ancient events within the local area.

first intentional use of fire
White (#5 on right) is the most burnt, while yellow-beige (on left #1) is unburnt. Image Credit: Wonderwerk Cave Project.

After exposing the ancient bone to specific wavelengths of light, the team found what they described as “clear signs of burning.” Dr. Horowitz confirmed the findings, noting that the team’s analysis reveals “fire was repeatedly present deep inside Wonderwerk Cave.”

Because the deposits were found over 30 meters deep in the cave, the team ruled out wildfires as a possible source of combustion. The layer also lacked bat guano remains, which the team noted “rules out spontaneous combustion.”

A chemical analysis of the charred bones dated them to between 1.07 and 1.79 million years ago, redating the 2012 findings. Critically, the evidence for ancient fire use was in an archaeological layer “associated with artifacts” from the initial Acheulean period, which is consistent with the dating. If correct, this would make the likeliest early human ancestor that used fire Homo erectus.

Although the findings appear to extend the chronology of one of the earliest known records of fire use associated with hominins by as much as 790,000 years, the research team said the findings do not suggest that these early proto-humans could create fire “at will.” Instead, the likeliest scenario involves early human ancestors collecting fire from natural sources, such as lightning-induced wildfires on the African savanna, and bringing it into the cave.

“The early humans introduced this fire into the cave on multiple occasions and maintained it there before it eventually died out,” the team’s statement explained.

The team did not immediately pinpoint what methods these early hominins used to maintain a burning fire. However, they suggested that burning owl pellets as additional fuel may inadvertently have scorched the rodent bones.

A New Tool for Identifying Traces of Burning

When discussing the implications of the new, earlier date for the first intentional use of fire, Dr. Horwitz said the discovery shows that early human ancestors “were not simply passive observers of natural fires,” but instead were “actively engaging with fire and incorporating it into their lives.”

Beyond offering an earlier date range for early fire use, the work provides clues into how our ancestors used fire before they could make it on their own. The study also debuted a new, non-invasive, portable tool for investigating early fire use, which the study authors note “can be applied to large collections of fossils without damaging them.”

“Our study provides new tools for identifying traces of ancient burning,” Dr. Horwitz explained, with the team adding that application of this new technique to sites around the world “may help clarify the origins and development of one of the most consequential technologies in human history.”

The study “New evidence for Early Pleistocene use of fire at Wonderwerk Cave (South Africa)” was published in PLOS One.

Christopher Plain is a Science Fiction and Fantasy novelist and Head Science Writer at The Debrief. Follow and connect with him on X, learn about his books at plainfiction.com, or email him directly at christopher@thedebrief.org.

  •  
  •  

A Hidden Subterranean Fungal Network is Revealing the Secrets of Earth’s ‘Circulatory System’


Ancient mycorrhizal fungal networks, consisting of a billion astronomical units’ worth of roots, have finally been mapped by scientists, providing insight into their connections, which are essential to climate regulation and plant sustenance.

Mycorrhizal fungi grow in an arbuscular formation, meaning they take on a branching tree-like structure of tubular cells called hyphae, which pull carbon from the atmosphere to aid in climate regulation.

The international team presented their work in a recent paper published in Science, which estimates the distribution and mass of these enormous fungal networks and provides an interactive visualization tool that offers crucial insight into threats to these systems, which are essential to Earth’s health.

Mapping Fungal Networks

The new research brings both encouraging and concerning findings, highlighting regions where fungal networks remain robust while also identifying areas under increasing threat.

Although previous studies have attempted to map the diversity of these fungi across the globe, this is the first effort to predict and visualize their density and biomass on a planetary scale. According to the team’s estimates, the network extends for approximately 110 quadrillion kilometers, with roughly 40% located beneath grasslands.

fungal map
The new map reveals the extent of the mycorrhizal fungal network globally. Credit: Truth & Beauty / Moritz Stefaner Justin Stewart – SPUN

Using more than 16,000 soil cores collected worldwide, researchers assembled a massive fungal dataset. They then employed machine-learning models that combined data from multiple biomes to predict the density of arbuscular mycorrhizal fungal networks in unsampled regions. Robotic imaging of more than 300,000 living, laboratory-grown hyphae allowed the team to calibrate and validate their models.

“It is hard to overstate the importance and enormity of these fungi,” said lead author Dr. Justin Stewart, with the Society for the Protection of Underground Networks (SPUN). “There could be up to 10 meters (32 feet) of mycorrhizal network in just a teaspoon of soil.”

Earth’s Circulatory System

Because it transports carbon, water, and nutrients underground, scientists have likened the network to our planet’s circulatory system, with a flow rate of up to 120 micrometers per second. About 70% of Earth’s plant species thrive on a symbiotic relationship with the arbuscular mycorrhizal fungi network.  The network can provide over 80% of a plant’s phosphorus and increase the root foraging area 100-fold. 

The network subsists on carbon waste produced by plants, while providing them with water and nutrients in return. By pulling in roughly 4 billion tons of CO2 into the ground every year, mycorrhizal fungi mitigate an amount corresponding to roughly 11% of human emissions.

Unfortunately, grasslands, where the network thrives most, are among the least protected environments on Earth and are being rapidly converted to farmland. According to the study team, cropland has only about half the lower network density of regular land, which the researchers worry may negatively affect how soil stores carbon, cycles nutrients, and resists stress.

Continuing Fungal Network Research

“It is important to remember that these maps are living documents. This is a first attempt at building a foundational model of Earth’s fungal networks infrastructure, but it is not complete,” Stewart recently told The Debrief. “There are other types of mycorrhizal fungi that still need to be mapped in more detail, and other fungal structures, such as spores, that are also critical to understanding how these organisms persist, move, and respond to environmental change. Likewise, we need more data in regions that have been poorly sampled.”

The team says the study represents a major advance for climate science, a field in which fungi have often been overlooked in discussions about conservation and resilience. Researchers hope the findings will encourage a more comprehensive understanding of the role fungi play in maintaining healthy ecosystems.

“A major goal now is to make these kinds of data useful for decision makers. Fungi are still rarely included explicitly in climate, biodiversity, and land-use agendas, even though they are central to how ecosystems move carbon and nutrients,” Stewart adds. “We want to help ‘course-correct’ by building a clearer picture of the underground systems that support life aboveground.”

The paper, “Global Density and Biomass of Arbuscular Mycorrhizal Fungal Networks,” appeared in Science on June 11, 2026.

Ryan Whalen covers science and technology for The Debrief. He holds an MA in History and a Master of Library and Information Science with a certificate in Data Science. He can be contacted at ryan@thedebrief.org, and follow him on Twitter @mdntwvlf.

  •  

Is Planet Nine Real? New Discovery at the Edge of the Solar System Adds a Twist

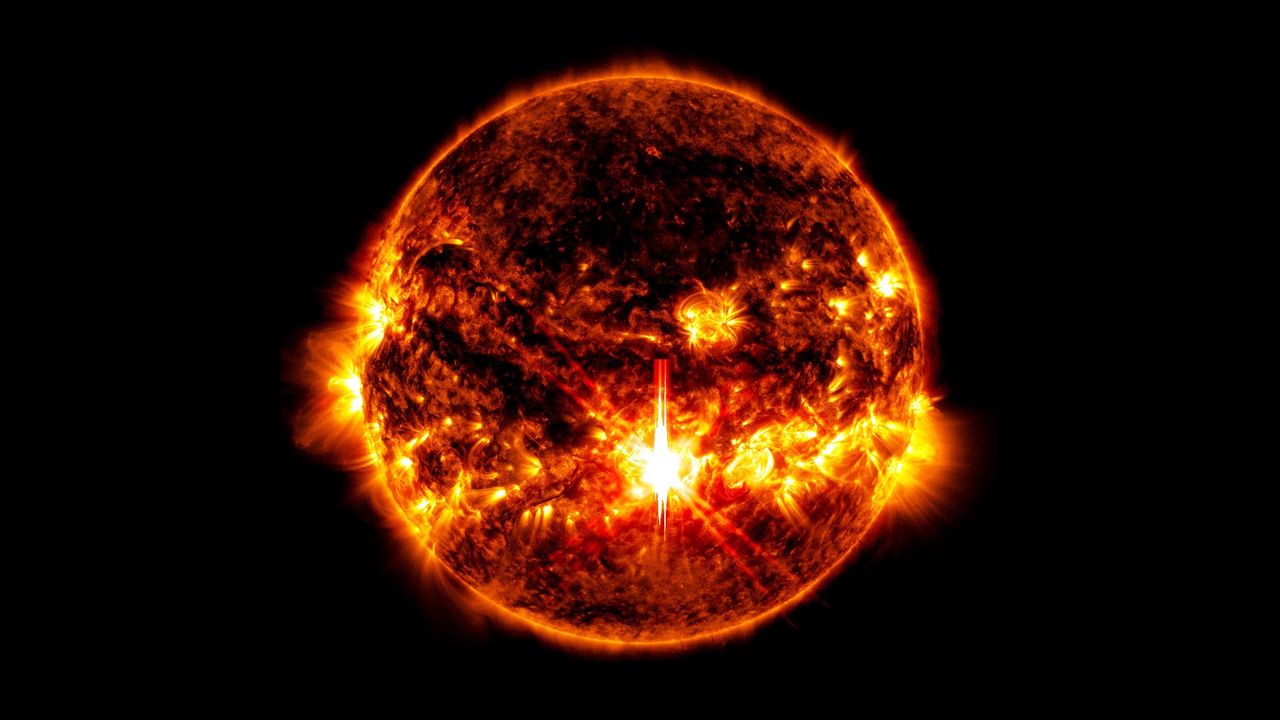
Sun Solar EclipseThe hunt for Planet Nine continues as new discoveries make the Solar System’s biggest mystery even harder to solve. Is there a massive undiscovered planet on the outer reaches of the Solar System? The idea has been around since before the discovery of Pluto in the 1930s. Labeled as planet X, prominent astronomers had put [...]
  •  

Scientists Found a Hidden Brain Signal That Predicts Social Behavior

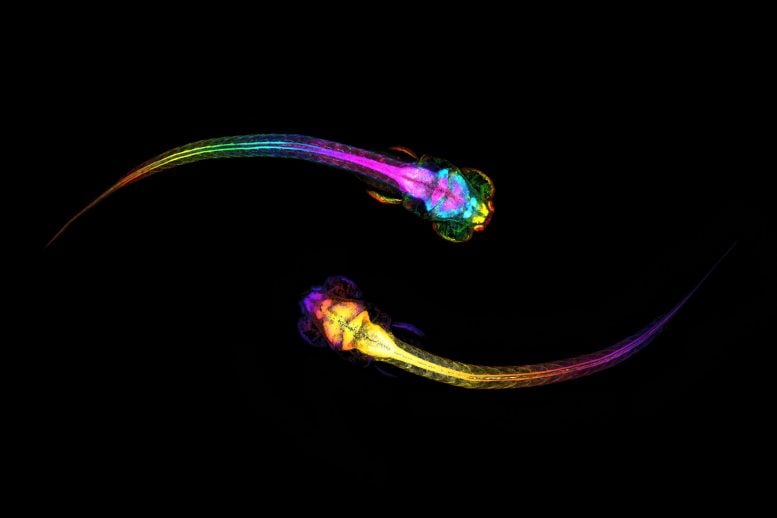
Two Socializing ZebrafishScientists discovered that the brain begins preparing for social connection before we even make the first move. Why do we decide to approach other people? According to new research, the answer may start unfolding in the brain several seconds before any movement takes place. A team of scientists from the Hebrew University of Jerusalem has [...]
  •  

Revised Artemis lunar lander plans take shape

Blue Moon Artemis 3

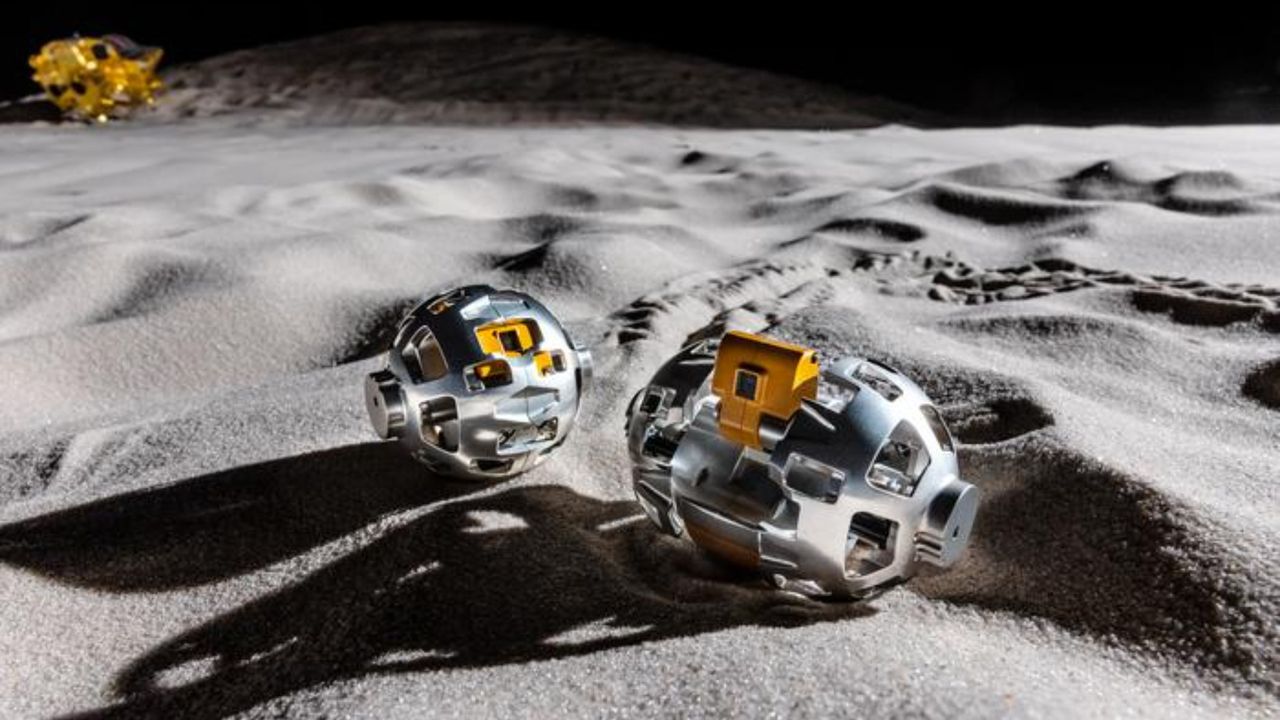
NASA has provided more details about the revised approaches that Blue Origin and SpaceX are taking to accelerate work on Artemis lunar landers.

The post Revised Artemis lunar lander plans take shape appeared first on SpaceNews.

  •  

Scientists Uncover What Kept Humanity’s First Campfires Burning 780,000 Years Ago

Gesher Benot Ya’aqov Excavation SiteRare charcoal fragments from an ancient lakeshore campsite are offering new clues about fire use, resource management, and the environmental knowledge of some of humanity’s earliest fire users. Long before cities, farms, or written language existed, some of humanity’s ancestors had already discovered a resource that would transform the course of human evolution: fire. But [...]
  •  

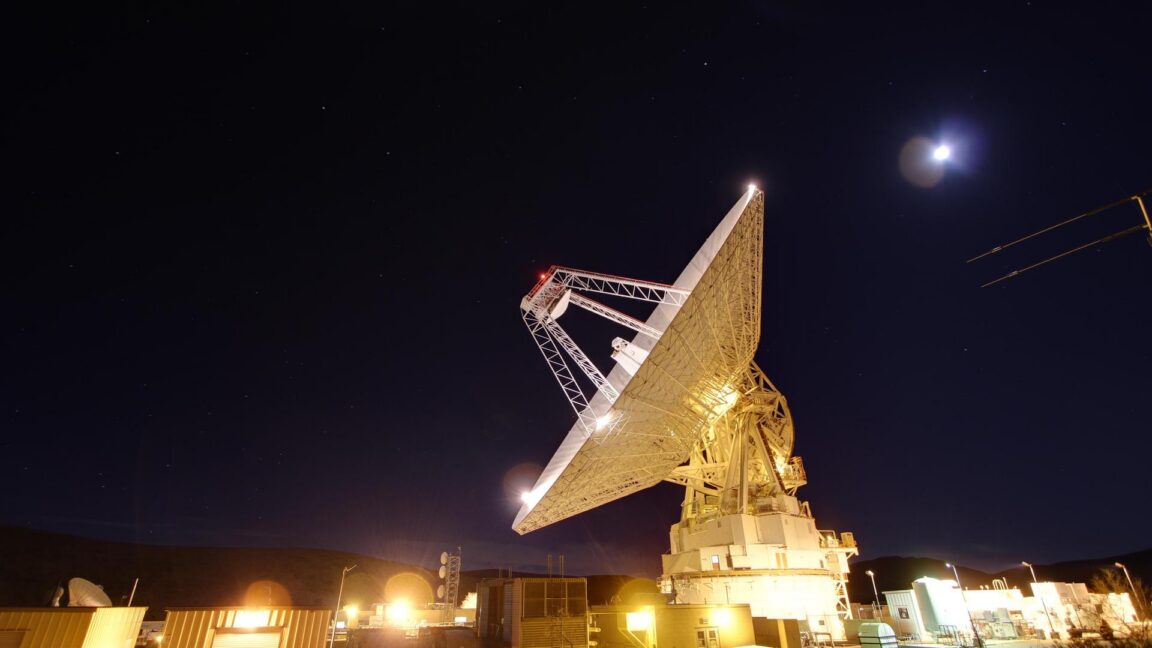
After nearly breaking, NASA's Deep Space Network "worked well" on Artemis II

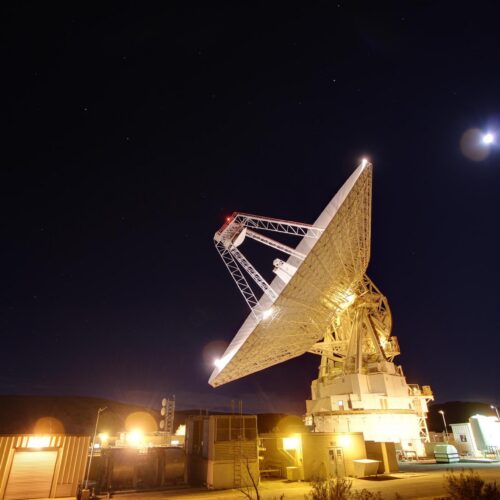
NASA pushed its Deep Space Network beyond its limits during the Artemis I mission nearly four years ago. The global array of deep space communications antennas couldn't keep up with the routine demands of 40 robotic science missions and the extraordinary surge required by NASA's Orion space capsule as it flew around the Moon.

The experience in late 2022 reduced or delayed downlinks from several high-profile science missions, including the James Webb Space Telescope and Mars rovers, as the data-hungry Artemis I mission took priority on NASA's communications network. And that was before the first Artemis mission with astronauts onboard. When Artemis II launched April 1, NASA called upon the Deep Space Network (DSN) again to connect Mission Control to the Orion capsule as it soared more than a quarter of a million miles from Earth.

With a crew of four flying inside the spacecraft, the agency's appetite for data from Orion on Artemis II was even higher than it was on Artemis I. But at a little more than nine days, the Artemis II mission was shorter than the 25 days Artemis I spent in space, helping alleviate the communications overload. Artemis I also launched 10 small CubeSats into deep space, many of which required tracking and telecom services from the DSN. Artemis II carried fewer CubeSats.

Read full article

Comments

© NASA/JPL-Caltech

  •  

Claude Fable 5 e Claude Mythos 5 são a última geração do modelo de IA da Anthropic mais poderoso do mercado

O Claude Fable 5 é a primeira versão pública da classe Mythos da Anthropic e supera todos os modelos anteriores em praticamente todos os benchmarks testados. Mas chegou ao mercado com salvaguardas tão conservadoras que perguntas básicas de biologia ativam o sistema de segurança.

The post Claude Fable 5 e Claude Mythos 5 são a última geração do modelo de IA da Anthropic mais poderoso do mercado appeared first on Tek Notícias.

  •  

Ícones da UE: Comissão Europeia lança os ícones oficiais para identificar conteúdos gerados por IA

A partir de 2 de agosto, deepfakes e textos de IA sobre assuntos públicos terão de ser identificados por lei. Bruxelas disponibiliza os ícones oficiais e gratuitos para facilitar o cumprimento do AI Act.

The post Ícones da UE: Comissão Europeia lança os ícones oficiais para identificar conteúdos gerados por IA appeared first on Tek Notícias.

  •  
❌