❌

Reading view

Dropping a dead solar panel into a U.S. landfill costs $1 to $5, while recycling the same panel has been estimated at $15 to $45. That gap helps explain why most go into the ground, even though a plant that opened in Georgia this year says it recovers 96 percent of a panel’s material value.

What does it actually cost to throw away the future? For a retired solar panel in the United States, the answer is surprisingly small, and that small number is deciding where the panel ends up.

The National Renewable Energy Laboratory (NREL) estimates it costs roughly $1 to $5 to landfill a silicon module and $15 to $45 to recycle one. Faced with that spread, most panel owners do the obvious thing. Fewer than 10% of decommissioned US panels are recycled.

That gap is worth naming, because it isn’t really about whether recycling is possible. It plainly is. The gap is about who pays, and when, and that turns out to be a very different kind of problem.

Why the cheap option keeps winning

A solar panel is not a mysterious object. Roughly 75% of a crystalline silicon panel by weight is glass, with an aluminum frame, a junction box, silicon cells, and small amounts of copper and silver threaded through it. The trouble is that the parts worth money are the parts hardest to get at, and the part that’s easy to handle, the glass, is worth almost nothing on its own.

So the economics run backwards from what you’d hope. NREL’s own behavioral modeling of US modules through 2050 found that, under baseline conditions, about 80% end up landfilled, 1% reused, and 10% recycled. Landfilling wins not because anyone prefers it, but because it’s the option that clears at the lowest price on the day the panel comes down.

Contrast that with the European Union, where producer-responsibility mandates fold the cost of end-of-life handling into the product from the start. Under those rules, recycling a panel has been put at about $0.75 per panel, and EU recycling rates reach 95%. Same physics, same materials, wildly different outcome. The variable is policy, not chemistry.

What actually costs money when you take a panel apart

Pulling the aluminum frame and the junction box off a panel is straightforward. The expensive step is what comes after: cleanly separating the glass from the silicon cells, then extracting the tiny quantities of silver and copper that sit inside. Those metals are where the recoverable value lives, and they are present in vanishingly small amounts. Silver sits at well under a tenth of a percent of a panel’s weight, yet it drives the recycling math.

Because clean separation is hard, many operations skip it. They shred the whole panel and sell the low-value glass cullet, capturing a fraction of what’s there. And the prize for doing the harder work isn’t large: an electrical engineer writing in The Conversation estimates the recoverable silver and copper in a single panel are worth only about $10 to $12, which is why recycling loses money under current processes. Layers glued together make the glass reclamation harder still.

The field’s own practitioners have been candid about the limits. As of 2022, Arizona State University’s Meng Tao, who works on PV recycling, told Chemical & Engineering News that “The recycling technologies we have today are still rudimentary.” That was an assessment of a young field, and the field has moved since. The same Conversation piece notes that advanced methods like salt etching can now recover over 99% of silver and 98% of silicon at high purity. The capability is arriving. Whether the economics arrive with it is the open question.

The Georgia plant’s bet

Which brings us to Cedartown. On January 29, 2026, SOLARCYCLE began commercial operations at a 255,000-square-foot plant that the company says recovers 96% of a panel’s material value and achieves 100% landfill diversion. According to CEO Suvi Sharma, the ” recycling facility in Cedartown represents a step-change in how we’re delivering end-of-life infrastructure.”

The more interesting move, to our eye, is what’s planned next door. SOLARCYCLE intends to feed the recovered glass into an adjacent solar-glass factory, with more than 80% of that plant’s planned 5 GW capacity already committed and first glass production slated for 2028. That vertical integration matters because it changes the value of the least-valuable material. If the glass has a buyer waiting rather than a landfill, the whole equation shifts. Sharma frames the ambition plainly: “The next phase of our growth is all about bringing solar recycling to industrial scale and delivering winning economics for our customers.” That’s a stated aim, not a demonstrated result, but it names the actual barrier: scale.

Not everyone is sold on the crush-and-separate approach. Terry Ko, chief operating officer of PV Circonomy, whose company markets a layer-by-layer alternative, has argued that “Once glass, silicon, metals, and polymers are reduced into mixed particles, contamination becomes a significant challenge regardless of the subsequent separation technology employed.” Ko has a commercial stake in that critique, and the trade coverage it appeared in noted the absence of industry-wide purity standards. Worth hearing, not yet settled.

The retirement wave that’s already loading

All of this would be an academic argument if the panels weren’t coming. They are.

NREL’s Garvin Heath put the timing plainly: “Installations two decades ago are nearing their end of life, and that becomes a challenge for the waste industry.” Roughly one million tons of US panel waste is expected by 2030, and NREL’s global assessment projects the volume of retired modules could reach up to 80 million metric tons by 2050. That’s a forecast, not a certainty, but the trend line under it is firm: US utility-scale solar is set to add 70 GW of new solar capacity across 2026 and 2027. Every panel installed is a panel that will one day retire.

There’s also a supply-chain angle that reframes the whole thing. Several of the metals inside panels appear on US critical-minerals lists and are largely imported. Recovered silver, copper, and silicon are not just waste avoided; they’re domestic material that didn’t have to be dug up or shipped in. Heath’s argument is that the lead time here is long, so the work has to start early: “Because it takes a long time to develop technology and policy and solutions to dealing with end-of-life products, this is something we need to start to address today.”

Incentive, not inevitability

The technology to recover most of a panel exists, salt etching hits high-purity numbers, and a plant in Georgia is now claiming near-total value recovery. What keeps most panels in the ground is that landfilling is cheap on the day the decision gets made, and the cost of recycling lands on whoever is holding the panel at end of life rather than on whoever profited from it at the start.

The EU’s $0.75-per-panel figure is the tell. When the cost is built in early and the value chain is closed, the same object that looks like expensive waste in one system looks like feedstock in another. Cedartown’s bet on selling its recovered glass next door is a private-sector version of the same logic: make the low-value material worth something, and the math stops fighting you.

The $1-to-$5 number isn’t telling us that recycling is too hard. It’s telling us who currently pays for the easy way out. Change that, through mandates, through scale, or through a buyer waiting on the other side of the shredder, and the cheap option stops being the only rational one.

The post Dropping a dead solar panel into a U.S. landfill costs $1 to $5, while recycling the same panel has been estimated at $15 to $45. That gap helps explain why most go into the ground, even though a plant that opened in Georgia this year says it recovers 96 percent of a panel’s material value. appeared first on Space Daily.

  •  

Modern humans interbred with Neanderthals before they disappeared, and most people of non-African ancestry still carry roughly 1 to 4 percent Neanderthal DNA today — meaning part of the human population we once thought we simply replaced never actually vanished

A man who died in a Romanian cave about 40,000 years ago carried more Neanderthal DNA than any other human ever sequenced, ancient or modern. His jawbone turned up in Peștera cu Oase, and when geneticists analysed it the result was startling: between six and nine per cent of his genome came from Neanderthals. Because those segments were still long and unbroken in his chromosomes, researchers reporting in Nature could work out that he’d had a Neanderthal ancestor only four to six generations back.

He was simply closer to the event than anyone alive today.

What the first Neanderthal genome settled

For most of the twentieth century the textbook story was replacement. Modern humans left Africa, Neanderthals died out, end of chapter. Anatomists had spent decades staring at skull shapes and reaching opposite conclusions from the same fossils. That held until 2010, when a draft sequence of the Neanderthal genome, assembled by Richard Green, Svante Pääbo and a large team from bones found in Vindija Cave in Croatia, showed that Neanderthals shared more genetic variants with living Eurasians than with living sub-Saharan Africans. Their estimate put the Neanderthal contribution to non-African genomes at one to four per cent.

Sixteen years of better data have tightened that figure rather than overturned it. Most current estimates sit closer to one or two per cent, with East Asians carrying about a fifth more than Europeans.

The meeting had a duration

How long did the two species actually overlap before Neanderthals disappeared? Two papers published on the same day in December 2024 finally gave a precise answer. A study in Science, led by Leonardo Iasi and Manjusha Chintalapati, compared 58 ancient Eurasian genomes against 275 present-day ones and dated the average moment of mixing to about 47,000 years ago, with gene flow continuing for some 7,000 years. A companion analysis, published in Nature, examined 45,000-year-old remains from Ranis in Germany and Zlatý kůň in Czechia and traced the archaic stretches in those genomes to a single admixture event between 45,000 and 49,000 years ago, shared by every non-African sequenced so far.

Seven thousand years is a long time to call an encounter. It is longer than everything that has happened since the first cities of Mesopotamia.

The parts that did not make it

“These deserts may have formed very rapidly after the gene flow,” Leonardo Iasi, one of the authors on the Nature paper, told UC Berkeley. He was describing what he and his colleagues call Neanderthal deserts, long stretches of the modern genome where archaic DNA is completely absent. Ancient human genomes from roughly 40,000 years ago already show no ancestry in those deserts, which is what led him to that conclusion. Read plainly, it means certain Neanderthal variants were harmful enough in a modern human body to be scrubbed out within a few thousand years.

The Oase man makes a similar point from the other end.

For all his recent Neanderthal ancestry, his population left little genetic trace in later Europeans.

What the surviving fragments do

Picture Neanderthal DNA as a jigsaw dropped and scattered across a crowd. No single person holds more than a sliver, but the crowd between them is still carrying a fifth of the picture. That is roughly what Benjamin Vernot and Joshua Akey found, writing in Science in 2014, when they sifted the genomes of 379 Europeans and 286 East Asians and recovered Neanderthal sequence covering roughly twenty per cent of that species’ entire genome.

There is a second archaic contributor in the mix too. Priya Moorjani of UC Berkeley, a senior author on the 2024 Science paper, is now studying people of East Asian descent, who carry both a larger Neanderthal share and up to 0.1 per cent of their genome from the Denisovans, a population known mainly from a handful of bone fragments and an enormous quantity of statistics.

Some of the surviving Neanderthal DNA is doing useful work. The variants that reached high frequency cluster around immune function, skin pigmentation and metabolism, which fits a group that had spent a few hundred thousand years adapting to Europe’s winters and its pathogens before anyone else showed up.

Some of it is a liability. In a paper published in Nature in 2020, Hugo Zeberg and Svante Pääbo showed that the strongest genetic risk factor then identified for severe COVID-19 was a stretch of roughly 50,000 bases on chromosome three, inherited from Neanderthals and carried by about half the population of South Asia and around sixteen per cent of Europeans. One paper, one chunk of chromosome, and the biology behind it is still being argued over. The provenance, though, is not really in dispute.

What to call an ending like that

Extinction normally means a line stopping. Neanderthals did stop existing as a distinct population, around 40,000 years ago, and no amount of genetics changes that. What the genetic evidence changes is the shape of the ending. A population that dies out and a population that gets absorbed look much the same in the fossil record and nothing alike in the genome.

That leaves an odd little fact sitting in the middle of human prehistory. The last Neanderthals were not necessarily childless. Some of them had children, those children had children, and the arithmetic has been running quietly ever since, through a few hundred million bedrooms, down to whoever happens to be reading this.

The post Modern humans interbred with Neanderthals before they disappeared, and most people of non-African ancestry still carry roughly 1 to 4 percent Neanderthal DNA today — meaning part of the human population we once thought we simply replaced never actually vanished appeared first on Space Daily.

  •  

Sweden is moving parts of an Arctic city because decades of iron mining are deforming the ground beneath it — in 2025 a 672-ton church was placed on giant transporters and rolled five kilometers to the new city center

Kiruna’s church went for a walk in August 2025, at half a kilometre an hour, on 224 wheels.

The trip took two days and included a daily stop for fika, the Swedish afternoon coffee break, because some traditions outrank engineering schedules. One driver steered the entire building with a handheld control box across roughly twelve hours of travel, along a route crews had spent months preparing. The Associated Press, in coverage carried by CTV News, reported that a main road was widened from nine metres to 24 and a viaduct was dismantled to clear a new intersection. State-owned mining company LKAB, which paid for the whole performance, lists the church at 672.4 tonnes and 40 metres across. Thousands of people stood in the wind to watch a building do the one thing buildings are designed never to do.

Norwegian contractor Veidekke built the road the church rolled along and the foundations waiting at the far end, as documented by Dezeen. It was not the first tenant to make the trip. By July, AP counted 25 buildings already jacked onto beams and wheeled east, with 16 still queued behind them.

Why the ground is giving way

Beneath the town sits the largest underground iron ore mine on the planet. White Arkitekter, the practice behind the masterplan for the new city, describes daily extraction as the equivalent of six Eiffel Towers of ore, and notes that two thirds of Kiruna’s residents depend on the mine for work. Digging began in 1910. The church was completed two years later, a gift from the company, built on a hill so the congregation could look out over the town the company had also built.

Take enough rock out from under a place and the rock above fractures, sags and follows the hole down. Crews are now working towards a main level 1,365 metres deep, and the surface has been reporting back for years in split walls and buckled roads. In 2004 LKAB told the municipality that the centre would have to be picked up and shifted east, since the alternative was to stop mining.

Sweden chose the mine.

What it costs to relocate a town centre

The company’s own accounting is blunt about the scale. LKAB estimates that at least 3,000 dwellings are affected, 6,000 residents must move and 450,000 square metres of floor space stands in the way, with roughly a third of the urban centre inside the affected zone. The replacement centre opened in September 2022. Per France 24, shifting the church alone carried a price tag of 500 million kronor, about 52 million US dollars.

Then came the sequel. LKAB has since published an expanded impact area that adds a further 6,000 people and 2,700 homes to the queue over the next decade, and CNBC has put the company’s estimated compensation costs across that period at 22.5 billion kronor, roughly 2.4 billion dollars.

Not all of it reads as loss. The Institution of Civil Engineers treats the relocation as a rare chance to redraw a city from scratch: a denser centre planned around good lighting through the long polar dark, 3,000 new homes, and streets arranged so nobody lives more than three blocks from open country. The same assessment records that the rebuild has squeezed Sami reindeer herders, who were working the land long before LKAB arrived.

The residents who cannot be loaded onto trailers

Lars-Marcus Kuhmunen chairs Gabna, the reindeer-herding Sami community whose grazing corridors have already been carved up by the mine, the railway and the town. Speaking to Swedish public broadcaster SVT, he said a new mine at the Per Geijer deposit would mean the end of reindeer herding as they know it, because the ore sits beneath the last narrow passage his herds use between seasonal pastures.

Per Geijer is the reason the arithmetic keeps changing. A report by the Stockholm Environment Institute, covered by ArcticToday, found the project carries significant risk of breaching the Indigenous rights of Sami community members, in the words of senior research fellow Rasmus Kløcker Larsen. That is one institute’s assessment rather than a court ruling, and permitting has years to run. The deposit holds 1.2 billion tonnes of mineral resources including 2.2 million tonnes of rare earth oxides, which is why the European Union has flagged it as strategically important for cutting its dependence on Chinese supply.

Reindeer, unhelpfully, cannot be rerouted by memo.

What happens to the building

Henning Larsen’s circular town hall anchors the relocated core, and the church is due to reopen at its new address, between the cemetery and the new town centre, in 2026. Parts of the stone wall that ringed the old site will be moved across to join it. Where it used to stand becomes a mining town park, kept as a quiet green space until the ground beneath it is needed, at which point the fences go up and the park goes the way of the neighbourhood.

Kiruna has become very good at a peculiar skill: treating permanence as a logistics problem with a budget attached. Beams, jacks, 224 wheels, a control box and a coffee break. A church can be lifted onto a trolley and driven down the road. A migration route cannot.

The post Sweden is moving parts of an Arctic city because decades of iron mining are deforming the ground beneath it — in 2025 a 672-ton church was placed on giant transporters and rolled five kilometers to the new city center appeared first on Space Daily.

  •  

Researchers picked oyster, mussel and cockle shells off Irish beaches, crushed the 3 kinds of shell into grains, and dropped them into water carrying rare earth metals at concentrations similar to badly polluted industrial runoff. The oyster grains took up as much as roughly 1.5 grams of metal for every gram of shell.

Collection of empty oyster shells in natural setting, showcasing coastal beauty.

A single gram of crushed oyster shell pulled in up to around 1.5 grams of rare earth metal, more than the shell’s own weight, out of water spiked with the kind of contamination you would expect from severe industrial pollution. A throwaway material, the sort of thing you might crunch underfoot on a beach, holding more than its mass in metals that the electronics and clean-energy industries fight over.

That’s the finding a Trinity College Dublin team reported in early 2026. Below, we walk through what they actually did, why oysters won and mussels and cockles fell short, and how much of this holds up once you leave the lab bench.

What the researchers actually did

The setup was low-tech at the front end. As reported in The University Times, the team collected oyster, mussel and cockle shells from beaches around Dublin, cleaned them, dried them, and crushed them into small grains. Then they dropped those grains into solutions carrying three rare earth elements and watched what happened over time. The three metals were lanthanum, neodymium and dysprosium, at concentrations chosen to mimic badly polluted water.

The chemistry underneath is where it gets interesting. Shells are mostly calcium carbonate, and in the rare-earth-rich water that calcium carbonate dissolves and is replaced, more or less on the spot, by new solid minerals built around the rare earth metals. In the peer-reviewed paper, published in Science of the Total Environment, the crushed shells were reacted with the metal-rich solutions across a wide range of temperatures, 25 to 205 degrees Celsius for up to three months. What you end up with is not the original shell soaking up metal like a sponge, but the shell being rebuilt, mineral by mineral, into something new.

As principal investigator Juan Diego Rodriguez-Blanco put it, “the process is entirely mineral-driven – the shells naturally transform dissolved rare earth elements into new solid minerals, so this isn’t a process that is difficult to drive, or one that requires much financial outlay or technical equipment.” That last part is a lab-based expectation rather than a proven cost sheet, but the appeal is easy to see: no exotic reagents, no elaborate rig, just waste shell and time.

Why oysters won and the others didn’t

All three shells are made of the same basic stuff, so why did oysters run away with it? The answer is structure. Oyster shell has a porous, layered microstructure, and that lets the dissolve-and-replace reaction work its way right through the grain rather than stalling at the surface. That’s how oyster grains reached uptake of up to roughly 1.5 grams per gram.

Mussels and cockles behaved differently, and the reason is more physical than chemical. A crust of new mineral formed quickly on the outside and then sealed the grain off, so the reaction couldn’t reach the inside. In those shells, the study reports that more than half of the original shell was left unchanged once that crust became impermeable. Same starting material, very different outcome, decided by how the shell is put together.

Why pull rare earths out of water at all

Rare earth elements are the unglamorous ingredients in a lot of modern hardware, from the magnets in wind turbines and electric motors to phone components. Mining them is expensive and messy, and industrial processing can leave behind runoff carrying dissolved metals. Two problems are tangled together here: recovering a valuable resource, and cleaning up water that carries it.

The shell angle is attractive partly because the raw material is a nuisance to begin with. As first author Rémi Rateau described it, “every year, the global aquaculture industry generates millions of tonnes of shell waste, much of which is discarded or sent to landfill.”  Rateau also noted that “relatively small amounts of shell waste could remove substantial quantities of rare earth metals from contaminated water.” 

What this is, and what it isn’t

This is one study, and it is a lab result. The concentrations were high by design, the conditions were controlled, and real industrial wastewater is a far messier soup of competing ions, organics and pH swings than a prepared solution in a flask. The team is upfront that the work still needs pilot-scale testing under genuine conditions before anyone talks about a deployable cleanup system. A promising lead is not a finished product, and this sits firmly in the former category.

Our read lands roughly where the team’s does. The measured uptake is striking, the input material is cheap and otherwise wasted, and the driving chemistry looks simple. Rodriguez-Blanco frames the ambition plainly: “we can start designing” low-cost strategies to remove critical metals from contaminated waters while giving new value to a major waste product. Start designing is the honest verb. On the strength of these numbers, it’s a lead worth taking out of the beaker and testing against the real, dirty water it was built to handle.

The post Researchers picked oyster, mussel and cockle shells off Irish beaches, crushed the 3 kinds of shell into grains, and dropped them into water carrying rare earth metals at concentrations similar to badly polluted industrial runoff. The oyster grains took up as much as roughly 1.5 grams of metal for every gram of shell. appeared first on Space Daily.

  •  

When Cape Hatteras Lighthouse was built in 1870, the Atlantic sat about 1,500 feet away, but by 1999 the ocean had crept to within 60 feet — engineers lifted the entire lighthouse and moved it 2,900 feet inland, five feet at a time

Bar soap moved a lighthouse. Crews smeared ordinary Ivory soap along the steel beams the tower rode across, because it turned out to be the ideal lubricant for a job involving thousands of tons of creeping brick, a detail recorded at the time by the Lighthouse Directory.

Everything else about the job was considerably less homely.

Why a lighthouse ends up in the surf

When Cape Hatteras Lighthouse was finished in 1870, it stood a comfortable 1,500 feet from the Atlantic. Then Hatteras Island did what barrier islands do, which is travel. Storm tides strip sand off the ocean side and dump it on the sound side, and the whole island shuffles westward, a process the National Park Service traces back at least 10,000 years.

The island moved. The lighthouse stayed exactly where the builders left it.

Underneath sat yellow pine timbers resting in fresh water on compacted sand, a floating foundation improvised because pilings could not be driven through hard sand barely eight feet down. Ingenious for 1870, and considerably less reassuring once the surf reached the door. By the late 1990s the ocean had closed to within 60 feet of the base, per the park service’s account of the light station, and decades of groins and sandbags had mostly made the erosion worse.

How to move five thousand tons of brick

Very slowly, and with an enormous amount of hydraulics.

Crews cut the tower free of its foundation, all 4,830 tons of it by the park service’s own retrospective, and replaced it with a grid of seven main beams, each 70 feet long and weighing 11 tons, fitted with 100 hydraulic jacks, as documented by Island Free Press. Those jacks raised the lighthouse 5.34 feet, just enough to slide roll beams underneath and give it a road. Horizontal push jacks then nudged the tower forward about five feet, backed off, shifted position along the beams, and pushed again, a sequence the park service sets out in its move FAQs. Each shove took about a minute, in coverage by the National Parks Conservation Association, and beams the tower had already passed over were carried round to the front to extend the track.

Progress ran to roughly 100 feet a day, with crowds cheering pushes that were barely visible to the naked eye, as Our State magazine later described the scene.

Twenty-three days, 2,900 feet, $11.8 million, and one American Society of Civil Engineers award the following year. International Chimney Corp of Buffalo held the contract. Expert House Movers of Maryland did the shoving.

The argument that came first

None of this was settled quietly. Relocation had been on the table since the National Academy of Sciences recommended it in the late 1980s, and North Carolina State University reached the same conclusion in a review published in January 1997, as Coastal Review later recounted, but plenty of locals were convinced the tower would shake itself to rubble halfway down the track. Congress funded the move anyway in 1998. The lawsuit that followed now sits in an administrative record held by the State Archives of North Carolina, a tidy paper monument to a very loud argument.

What the ocean has done since

The tower now stands about 1,500 feet from the water, the same margin it enjoyed in 1870, and should not be threatened again for something like a century, according to the State Library of North Carolina’s history project on the relocation.

Nearby property has fared worse. At least 32 privately owned beach homes have collapsed onto Cape Hatteras National Seashore since 2020, most of them at Rodanthe and Buxton, with the latest counted by National Parks Traveler in June. Each one brings a notice from Cape Hatteras National Seashore warning visitors about nail-studded debris drifting for miles down the beach. Superintendent David Hallac has pointed out that earlier generations built smaller and shifted buildings when the surf came for them, which is a polite way of saying the island never agreed to stay still.

Cracks the sea did not cause

Scaffolding went up in 2024 for what was meant to be an 18-month restoration costing $19.2 million, and the work has turned up something awkward. Crews expected 30 to 40 cracks in the cast-iron brackets carrying the gallery deck near the top. They found 116, spread across all 16 brackets, Stone & Lime superintendent Josh Brundige told a media tour in July, in reporting by Outer Banks Insider. Most were hidden under seven layers of brick, and the documentation of them predates the 1999 move.

Nobody can say what caused the cracking. Brundige offered thermal expansion and water damage as candidates, with generations of whale oil flame heating the lantern room and winter cooling it down again.

So the lantern room is currently missing from the tower altogether, a temporary beacon is doing the work, and the repair has added about a year and $10 million, taking the project to roughly $30 million. Moving a lighthouse five feet at a time was, in the end, the easy part. Whatever quietly split the ironwork at the gallery deck was already there, decades before anyone thought to look.

The post When Cape Hatteras Lighthouse was built in 1870, the Atlantic sat about 1,500 feet away, but by 1999 the ocean had crept to within 60 feet — engineers lifted the entire lighthouse and moved it 2,900 feet inland, five feet at a time appeared first on Space Daily.

  •  

In 1980, a Texaco crew drilling over Louisiana’s Lake Peigneur missed their mapped position by about 400 feet and punched into a working salt mine below, and within hours the entire lake had drained into the hole, swallowing 11 barges and briefly reversing a canal that ran to the Gulf

Lake Peigneur, in the Cajun country of southern Louisiana, was a modest body of water with an unusual basement. The lake itself was about 1,300 acres and only ten or eleven feet deep — a placid fishing spot beside the Rip Van Winkle Gardens. Beneath it, however, rose the top of a salt dome, and inside the dome the Diamond Crystal Salt Company had been mining since 1919, carving out cathedral-sized galleries that by 1980 descended fifteen hundred feet, some of them running directly under the lake bed.

Two industries, stacked vertically, each aware of the other. Everything depended on the maps.

On the morning of November 20, 1980, a crew contracted by Texaco was probing for oil from a drilling rig floating on the lake. At around 430 feet down, their 14-inch drill bit stuck, the rig began to tilt, and the drillers — suspecting nothing worse than a collapsing borehole — evacuated to shore.

By most accounts, their position was off by roughly 400 feet. The bit had gone through the lake floor and into the third level of the mine.

The drain plug

What followed remains one of the most surreal industrial accidents ever recorded, and it unfolded with the logic of a bathtub.

A 14-inch hole should not drain a lake quickly. But water pouring into a salt mine does not just fill space — it dissolves the walls, and the pillars of salt deliberately left behind to hold up the ceiling. The puncture widened itself by eating its own edges, the flow compounded, and within a couple of hours the entire lake was corkscrewing down through the mine in a whirlpool hundreds of feet across.

The vortex took the drilling rig first — a derrick 150 feet tall, sucked under in minutes. Then it took eleven barges from the adjacent canal, a tugboat, trucks, a parking lot, greenhouses, and about 65 acres of Jefferson Island itself, as the shoreline calved into the spinning hole. Sixty-five-foot oaks went down whole. On the far side of the lake, a fisherman’s small boat was dragged toward the drain until he grounded it and ran.

Underground, the day’s shift — around 50 miners — was at work when the water arrived. Their escape is the disaster’s miracle chapter: warned by a fuse-blowing short and then by the sight of water where water could not be, they evacuated level by level, some riding out in mine carts, the last men lifted up the shaft in an elevator built for eight as diesel smoke and rising water chased them. Every miner surfaced. So had every driller. In an accident that swallowed a lake, a rig, a fleet and a chunk of Louisiana, not one person died.

The backwards canal

The lake, once empty, had to refill from somewhere, and here the disaster produced its most famous image. The Delcambre Canal had always carried Lake Peigneur’s overflow south to the Gulf of Mexico. With the lake now a mud crater far below sea level, the canal reversed, and salt water from the Gulf came pouring backward and down into the basin — over a drop that, for two days, formed the tallest waterfall in Louisiana’s history, some 150 feet of it, on terrain otherwise famous for being flat. Compressed mine air blasted back up through the drain as 400-foot geysers.

When the refilling ended, nine of the eleven barges popped back to the surface like bath toys. The rig and the tug never reappeared. And the lake itself had been transmuted: a shallow freshwater pond had become a deep, salty, stratified lake with a new ecosystem to match — the fastest limnological conversion on record, performed in one afternoon.

The bill, and the blur

The aftermath settled the way American disasters do. Diamond Crystal’s mine was destroyed; the company took $32 million from Texaco and its drilling contractor in settlement, with another $12.8 million to the ruined botanical gardens, and the mine closed for good a few years later, ending six decades of salt work. The precise cause was never officially pinned down — the evidence, inconveniently, had dissolved — but the settlements spoke, and the working explanation has never been seriously rivaled: a surveying error of a few hundred feet, on a map where a few hundred feet was the entire margin between two industries.

That is the durable lesson floating over Lake Peigneur, which today looks placid again and is, incidentally, much deeper than any map from 1979 says. The drillers did everything right by the coordinates they had. The mine was exactly where its own maps said it was. The catastrophe lived entirely in the gap between the two sets of paperwork — about 400 feet of it — and when the gap closed, it closed with a whirlpool. Nobody drowned, but a lake did: pulled down its own drain, through a hole the width of a dinner plate, into the space where men had been mining salt that morning.

The post In 1980, a Texaco crew drilling over Louisiana’s Lake Peigneur missed their mapped position by about 400 feet and punched into a working salt mine below, and within hours the entire lake had drained into the hole, swallowing 11 barges and briefly reversing a canal that ran to the Gulf appeared first on Space Daily.

  •  

Researchers took biochar made from human waste at a treatment plant in Warangal, India, ground it into a fine black powder and mixed it into concrete in place of a tenth of the cement. After 91 days the concrete was 21 percent harder to crush.

From above of textured background of rough surface with loose texture cracks and sand

Concrete is the second most-used substance on Earth after water, and the cement that holds it together is one of the biggest headaches in climate policy.

Making cement means heating limestone until it breaks down, a process that accounts for around 8 percent of global CO2 emissions. And we are not slowing down. Concrete production is projected to climb from roughly 14 billion cubic metres a year toward 20 billion by mid-century. So anything that lets you use less cement per wall, without the wall getting weaker, is worth a close look.

That is the claim in a new paper out of India, and it comes with an unusual ingredient: human waste. A team turned treated sewage sludge into a fine black powder, swapped it in for a tenth of the cement, and got concrete that ended up harder to crush, not softer.

It’s one study, and an early-access version still subject to edits, so treat what follows as a promising result, not a settled fact.

Why cement is the part worth fixing

The problem with concrete is not the gravel or the sand or the water. It is the cement paste that binds them together. Estimates of cement’s climate footprint vary a bit depending on how you count, landing somewhere between 5 and 8 percent of global human-caused CO2 emissions each year. Most of that comes from the chemistry of making cement, not the fuel in the furnace. That is why switching to cleaner energy alone will not fix it.

One line of research has spent years asking whether you can replace some of that cement with biochar. Biochar is a carbon-rich char made by heating organic matter with very little oxygen. The appeal is twofold: you use less cement, and the carbon in the char, which the original plant or waste pulled out of the air, gets locked inside the building instead of released. The open question has always been whether the concrete survives the swap.

What the Warangal team actually did

The material here started at a sewage-sludge treatment plant in Warangal, in the Indian state of Telangana, a facility set up as a public-private partnership to tackle the city’s sewage problem. Human solid waste that would otherwise be dumped or burned gets processed there.

V Srinivas Chary, whose institution is a partner on the project, praised the operation, saying that “From the toilet to the final conversion of the biochar, the process is scientific and comprehensive.” 

The research team, led by civil engineer Raghuvesh Tiwari of Manipal University Jaipur with colleagues at Louisiana Tech University, took that sludge, dried it, and heated it to between 350 and 450 degrees Celsius with very little oxygen. That heating step drives off gases and leaves char behind. They ground the char into a powder, then replaced 5, 10, and 15 percent of the cement in test concrete with it and ran the usual checks: how well it resisted crushing and bending, how much it shrank, how much water it soaked up, how many gaps it had inside.

Dumped waste versus a carbon sink in the wall

The study sets up a pointed contrast. Normally a city’s sewage sludge is a liability to be disposed of, and a builder’s cement is a material whose production loads the atmosphere. Both are problems flowing toward waste and emissions. The first is bigger than you might think: a single person produces up to around 400 grams of faeces a day, which across a city becomes a constant stream that has to go somewhere.

The idea here is to route that stream into the wall. The waste replaces some of the cement, and the carbon in the char stays put instead of being burned off. It is a tidy story on paper: two problems that might cancel out a slice of each other. The caveat is that this study did not actually measure the carbon side of that ledger, so the climate benefit is still an argument rather than a number the paper delivered.

Why it got stronger, not weaker

The surprise is that adding a char to concrete made it tougher. The study reports this clearly for the middle dose. As the authors put it, “After a 91-day curing period, concrete with a 10% biochar substitution demonstrated a 21% increase in compressive strength and a 42% increase in flexural strength.” The 5 percent mix was close behind, gaining about 20 percent in crushing strength and 36 percent in bending strength over the same period. Those gains are measured against this study’s own plain concrete, not a universal benchmark.

There is a limit, though, and the study found it. The 15 percent mix did worse. Past a certain point, the char stops helping and simply dilutes the cement, a useful reminder that the good result here depends on getting the dose right. The authors’ own summary is careful: the results indicate that biochar at the 5 and 10 percent levels “yields significant improvements in concrete properties.”

The catch, and what still has to be proven

A strong lab result is not a paving slab. Several things stand between this and a real building site, and the paper is upfront about the biggest one. Sewage sludge can carry heavy metals, and whether those slowly leak out of the finished concrete over time is an open question. That is not something you can wave away when the material might end up in a school foundation or a water channel.

How long it lasts is the other unknown. The tests ran to 91 days in controlled conditions. Real structures face decades of freezing and thawing, wetting and drying, weight and vibration, and nobody has shown yet how this concrete holds up over that span. The researchers say themselves that more work is needed to assess how it performs under real-world conditions such as freeze-thaw cycles and extreme temperatures. 

What the study earns, we think, is attention rather than adoption. The explanation is plausible, the numbers are real for the mix that was tested, and the idea that a waste stream and a carbon-heavy material might each solve part of the other’s problem is worth chasing. 

The post Researchers took biochar made from human waste at a treatment plant in Warangal, India, ground it into a fine black powder and mixed it into concrete in place of a tenth of the cement. After 91 days the concrete was 21 percent harder to crush. appeared first on Space Daily.

  •  

Astronomers used 69 fast radio bursts as cosmic backlights to complete the clearest census yet of the universe’s missing ordinary matter, finding that roughly 76% resides as extremely diffuse ionized gas in the vast spaces between galaxies — while only 9% remains inside galaxies as stars and gas.

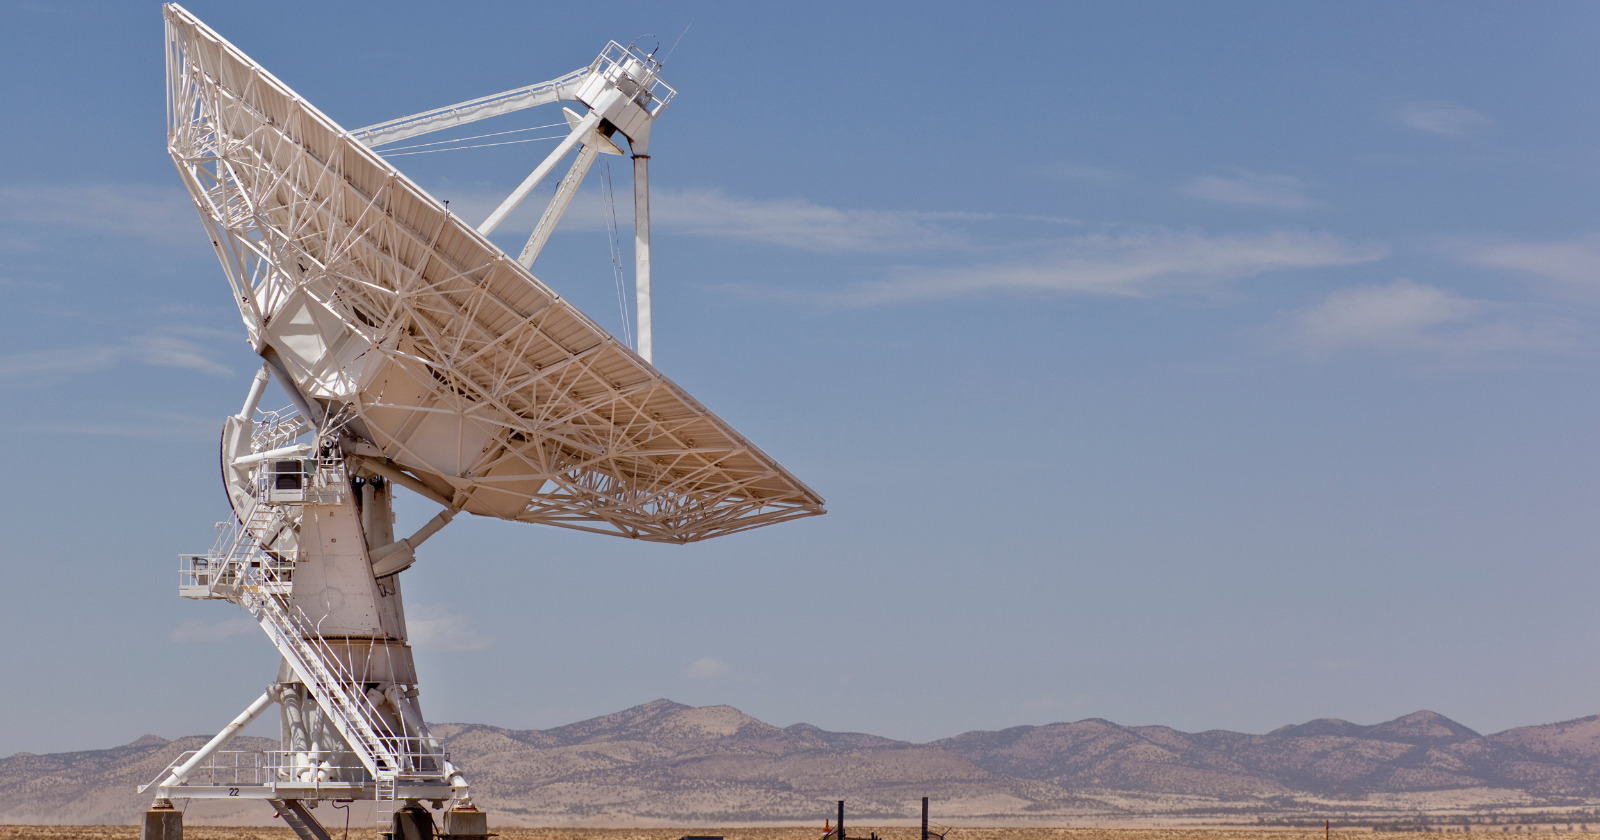
A radio telescope dish beneath a star-filled night sky

The universe’s “missing matter” was never thought to have vanished. Cosmologists could infer how much ordinary, atom-building matter should exist, but direct inventories of stars, cold gas and the hot gas in galaxy clusters did not recover all of it in the nearby universe. The discrepancy pointed instead to matter that is real, widespread and exceptionally difficult to see.

A census built from 69 precisely located fast radio bursts now places most of that elusive material in the thinnest part of the cosmic web. In a study published on 16 June 2025 in Nature Astronomy, Liam Connor and colleagues estimate that 76 per cent of ordinary matter lies in the intergalactic medium, with an uncertainty of plus 10 and minus 11 percentage points. About 15 per cent lies in extended galactic halos, while 9 per cent is in stars and cold galactic gas.

This is one study, not settled consensus. Its fractions are a statistical inference from a modest sample, foreground estimates and a model of where electrons reside. They are not a direct count of individual particles. Even so, the work makes a more discriminating partition of the late-universe baryon budget than earlier fast-burst measurements could provide.

The missing matter was ordinary

In cosmology, baryons are the family of ordinary particles that includes protons and neutrons, the ingredients of atomic nuclei. Measurements of the early universe, including the Planck cosmic microwave background analysis, tightly constrain how many baryons the cosmos contains. Big Bang nucleosynthesis reaches a compatible answer through the primordial abundances of light elements.

Yet stars are bright rather than abundant. Add stellar mass, cold galactic gas, hot cluster gas and other detectable reservoirs, and the local tally historically came up short of that early-universe prediction. The leading expectation was that much of the difference occupied the warm-hot intergalactic medium, spread through filaments so thinly that its emission and absorption signatures were hard to assemble into a complete census. Individual detections existed, but extrapolating them across an inhomogeneous cosmic web left substantial room between locating some of the reservoir and measuring its global share.

The 76/15/9 division is therefore not a breakdown of everything in the universe. It partitions ordinary matter alone. Dark matter is a separate, non-baryonic component, and dark energy belongs to the wider mass-energy budget. Ordinary matter makes up only about one-sixth of all matter, so 76 per cent of baryons is not 76 per cent of all cosmic matter.

How a millisecond burst weighs invisible gas

A fast radio burst, or FRB, is a brief flash of radio energy from a distant galaxy. Its physical source may differ from event to event, but that uncertainty does not prevent an FRB from working as a probe. What matters for the census is the signal’s journey through intervening plasma.

Ionized gas contains free electrons. When a burst passes through it, lower radio frequencies arrive slightly later than higher ones. The size of this frequency-dependent delay yields the dispersion measure, which is proportional to the column of free electrons integrated along the full sightline. Gas that is far too faint to photograph can still leave a measurable timing signature.

Distance turns that electron column into a cosmological tool. Once astronomers identify a burst’s host galaxy and measure its redshift, they can compare how far the signal travelled with how much plasma it encountered. They must also estimate the contributions from the Milky Way, the host galaxy and intervening galactic halos before attributing the balance to intergalactic space.

Why localization mattered

A burst without a securely identified host is much less useful because its distance remains uncertain. Thirty-nine of the 69 events in the study came from the Deep Synoptic Array-110 at California’s Owens Valley Radio Observatory. The array was designed not merely to detect FRBs, but to pinpoint them accurately enough for follow-up observations of their host galaxies.

The other 30 bursts came from telescopes around the world, primarily the Australian Square Kilometre Array Pathfinder. Optical observations from facilities including the Keck and Palomar observatories helped establish host redshifts. That combination, a radio dispersion measure tied to a known cosmic distance, is the essential unit in the analysis.

According to Caltech’s account of the project, the 69 localized bursts ranged from about 11.74 million to 9.1 billion light-years away. The most distant was FRB 20230521B. The long baseline supplied both nearby and remote probes of the accumulated electrons between galaxies rather than relying on a narrow slice of cosmic history.

The 76 per cent is an inference with error bars

The team’s intergalactic category means gas outside virialized galaxy halos, combining filaments and voids. The published estimate assigns 76 per cent of baryons to this reservoir, with a plus 10 and minus 11 percentage-point uncertainty. The central value is memorable, but the interval is part of the result and should travel with it.

The same analysis describes this gas as highly ionized and extremely diffuse. Its density is below roughly 0.001 particles per cubic centimetre, and its neutral fraction is below one part in 10,000. Those limits explain the observational problem: the gas can dominate the ordinary-matter inventory while producing little light of its own.

The remaining shares are about 15 per cent in the extended halos around galaxies and 9 per cent in stars and cold galactic gas. These are fitted population fractions, not three piles weighed independently. The open preprint record describes how simulations help calibrate the statistical fingerprints of the different components, including the uneven contributions from intervening halos.

What changed after the first FRB census

The crucial groundwork was the 2020 Macquart relation, named for the late astronomer J. Xavier Prochaska Macquart. Using a smaller set of localized bursts, that study showed that dispersion increases with redshift in a way consistent with the expected cosmic density of baryons. FRBs could recover the missing total.

Recovering the total was not the same as assigning matter to environments. The average dispersion-redshift trend mainly constrains how many baryons exist along the line of sight. Separating smooth intergalactic gas from the clumpier material around galaxies requires information in the distribution and scatter of individual measurements, plus knowledge of which foreground halos a sightline crosses.

The 69-burst analysis combines those clues. Diffuse gas produces a relatively smooth accumulation with distance, while halos add irregular contributions on selected sightlines. A previous SpaceDaily report on a record-distance localized FRB explains why reaching farther into the universe extends the lever arm for this kind of measurement.

A clue about galaxy feedback

If roughly three-quarters of baryons are outside halos, galaxies have not retained all the gas that gravity drew toward them. Supernovae, stellar winds and accreting supermassive black holes can heat gas and drive it outward. In simulations, the strength of that feedback determines how much material remains near galaxies and how much is expelled into the broader web.

The study argues that relatively efficient feedback is needed to reproduce the inferred split. That gives galaxy-formation models a new observational constraint: matching the number and appearance of galaxies is not sufficient if a simulation stores too much ordinary matter inside their halos. The baryon census tests the otherwise faint aftermath of billions of years of outflows.

Redistributed gas also changes how matter clusters on intermediate scales. The authors note that stronger baryonic feedback could reduce part of the S8 tension, a mismatch between some early- and late-universe estimates of clustering amplitude. That is a possible implication rather than a demonstrated resolution, and it depends on whether the inferred gas distribution survives larger and more varied FRB samples.

A census, not a map of every particle

The method is powerful precisely because electrons that are almost invisible in emission still delay radio waves. Its limitations follow the same line of reasoning. Each burst mixes contributions from the Milky Way, intergalactic space, foreground halos and its host. Errors in any of those components can shift the inferred partition even if the measured dispersion itself is precise.

Selection also matters. Only localized bursts with usable host information enter this kind of census, and that subset may not perfectly represent the full FRB population. The conversion from observed scatter to environmental fractions depends on halo prescriptions and on simulations such as IllustrisTNG. The quoted uncertainties reflect the statistical model, but no error bar can guarantee that every modelling assumption is complete.

Sixty-nine events are enough to sharpen the fractions, not enough to erase every degeneracy. Future arrays should supply thousands of localized sightlines, allowing the budget to be tested across redshift, galaxy type and foreground environment. The clearest conclusion for now is deliberately bounded: most ordinary matter long missing from visible inventories is consistent with very diffuse, ionized gas between galaxies.

The post Astronomers used 69 fast radio bursts as cosmic backlights to complete the clearest census yet of the universe’s missing ordinary matter, finding that roughly 76% resides as extremely diffuse ionized gas in the vast spaces between galaxies — while only 9% remains inside galaxies as stars and gas. appeared first on Space Daily.

  •  

A 14-year-old in New York folded 54 variations of the same origami crease pattern and stacked dumbbells on them to see which collapsed — the winning fold held more than 9,000 times its own weight, the design is aimed at flat-pack disaster shelters, and it took the $25,000 top middle-school prize

The apparatus for one of the year’s most celebrated student experiments was paper and gym equipment.

Miles Wu, 14, of New York City, spent his project folding the same origami pattern over and over — 54 systematic variations of it — and then crushing his own handiwork, loading dumbbells onto each folded structure until it gave way and writing down the number.

Last October, that stack of creased paper and weights won him the $25,000 top prize at the Thermo Fisher Scientific Junior Innovators Challenge, the national middle-school competition run by Society for Science — the junior sibling of the storied Science Talent Search.

The fold with a space career

The pattern Miles chose wasn’t decorative. The Miura-ori is the most famous crease pattern in engineering: a tessellation of parallelograms, invented by Japanese astrophysicist Koryo Miura, that collapses a large sheet into a compact block and — its signature trick — unfolds in one smooth motion, pulled open from two corners. Japan flew it to space in 1995 to deploy a solar array; it lives on in maps, satellite panels and stent designs.

What made Miles’s project science rather than papercraft was treating that famous fold as an unexplored parameter space. A Miura-ori isn’t one pattern but a family — panel size, crease angle, row count can each be tuned — and the structural consequences of those choices are exactly the kind of thing a kid with patience, paper and a weight bench can map exhaustively.

So he mapped it: 54 variants, each loaded with dumbbells until failure.

What the crushing revealed

The dataset produced a clean design law. Folds with smaller panels and steeper crease angles weren’t just stronger — they were remarkably resilient, holding their integrity rather than failing suddenly. Tighter, sharper folding packs more load-bearing geometry into the same footprint — more walls per square inch, effectively — and the best of his configurations supported more than 9,000 times their own weight before collapse.

For scale: a structure with that ratio, weighing as much as a bag of flour, would carry a car. And it started as a flat sheet.

The application Miles has named is the one the geometry begs for: strong, lightweight shelters that ship flat and deploy fast in disaster zones. Emergency shelter is a logistics problem before it is a housing problem — the structures are needed by the thousand, immediately, at the end of broken supply chains — and a Miura-based building would fly as a dense stack and open like a map, its strength coming from crease geometry rather than heavy framing. His prize-announcement plans point exactly there, putting him in step with a genuine research frontier: origami engineering is currently one of the busiest corners of structural design, from NASA solar arrays to foldable bridges.

The shape of a proper experiment

It’s worth pausing on the method, because it’s a miniature of how materials science actually works.

Miles didn’t invent the Miura fold, and didn’t need to. He took a known structure, varied it systematically along its natural parameters, tested every variant to destruction under identical conditions, and extracted a generalizable rule — smaller panels, steeper angles, more strength — that someone else could now apply at shelter scale without repeating the 54 experiments. One variable at a time, failure as data, the answer as a design principle rather than a single artifact. Plenty of graduate work follows a looser protocol.

And the equipment list is the story’s quiet punchline. The competition he won celebrates access to STEM, and his project is the proof of concept: no lab, no fabrication budget, no instrument more specialized than the family’s dumbbells. The expensive part was the discipline — folding the same pattern 54 times with controlled precision, and being willing to destroy every one of them.

The origami masters have always said the crease pattern is the real object; the paper is just where it lives. Miles Wu’s version of that idea now has numbers attached, a five-figure prize, and a possible future as the roof over someone’s worst week: fold it right, and a flat sheet will hold nine thousand of itself.

The post A 14-year-old in New York folded 54 variations of the same origami crease pattern and stacked dumbbells on them to see which collapsed — the winning fold held more than 9,000 times its own weight, the design is aimed at flat-pack disaster shelters, and it took the $25,000 top middle-school prize appeared first on Space Daily.

  •  

After more than 50 years, a solar telescope in New Mexico is being pulled down, after liquid mercury from the bearing that let its 250-ton optical system turn was found inside the tower. Crews found the metal on January 5.

A solar telescope in New Mexico is being torn down, and the reason is a pool of liquid mercury hidden inside it. The mercury was the clever trick that made the telescope work. It is now the thing that dooms it.

The telescope’s optical system weighs 250 tons, and it had to turn smoothly all day. You can’t spin something that heavy on ordinary wheels. So instead the whole thing floated on a sealed pool of liquid mercury. Mercury is dense and flows easily, so the load rode on the fluid and turned with almost no friction. That is how the 250-ton optical system of the Richard B. Dunn Solar Telescope was designed to move.

However, on January 5, crews found some of that mercury where it wasn’t supposed to be.

We are not engineers, chemists, or occupational-safety specialists, and nothing here is guidance for handling mercury or any other hazardous material. This is our reading of a public engineering story and the agency documents around it, not advice.

Why a telescope floated on liquid metal

The Dunn sits at about 9,200 feet on Sacramento Peak, inside the Lincoln National Forest. The Air Force built it, and it opened as the Vacuum Tower Telescope on October 15, 1969. From the start it was one of the best high-resolution instruments in the world for studying the Sun.

As sunlight comes through the telescope, the Sun’s image slowly rotates over the course of a day. To keep that image lined up with the instruments studying it, you have to turn the whole optical assembly to match. Not just the tube, but the observing room, the lab, and the floor people stand on. That is where the 250 tons comes from. The mercury float let crews rotate the image of the Sun by turning the entire instrument.

The amount of mercury involved surprises people. The system floated on roughly 120 gallons of the liquid metal, sealed in the bearing. Mercury is so dense that this much weighs around 18,000 pounds on its own. And the bearing carrying the full load hung, according to the observatory, on just three bolts, each three inches across.

The result was a turn so smooth it sounds made up. Dave Dooling, a science writer who served as the site’s education officer, described it this way: the bearings “make rotation so smooth that a person could stand with one foot on the main floor and one on the turntable and slowly rotate all 250 tons” of it. That captures what the mercury bought: a huge instrument you could nudge by hand.

What crews found on January 5

On January 5, 2026, two New Mexico State University staff members found liquid mercury on a platform inside the tower. The site closed, along with its visitor center.

A puddle of mercury is a serious problem because of what the metal does. It is a neurotoxin, it gives off vapor at room temperature, and once it escapes a sealed system it doesn’t stay put. The real question became whether the bearing could be trusted to hold 18,000 pounds of a poison for years to come. The National Science Foundation brought in the engineering firm Thornton Tomasetti to assess that, and the answer shaped everything that followed.

Why removing the mercury ends the telescope

The mercury isn’t a part you can swap out. It is the thing the entire optical system stands on. Take it away and the telescope can’t rotate, which means it can’t do the one job it was built for. Removing the hazard and keeping a working telescope turned out to be the same decision pointing in opposite directions.

On February 24, 2026, the NSF announced it would remove the mercury, leaving the telescope permanently unusable, then demolish it. In its own words, “After assessing the engineering challenges, anticipated repair costs and safety and environmental risks, NSF determined that removing and safely disposing of the telescope’s mercury is the most prudent course of action.” That is the agency defending its own call, and worth reading as such. Preservation advocates in New Mexico dispute that demolition was the only option, and residents and lawmakers have pushed to save the wider observatory campus.

The Dunn was already near the end of its working life. The Air Force transferred it to the NSF in 1976, and in its final years it ran only in a limited mode since 2019. Much of what it once did best has moved to the NSF’s newer, far larger Inouye Solar Telescope in Hawaii. 

What comes down with it

Demolition is scheduled to begin as early as September 2026, and the NSF has said it will contribute up to $100,000 toward an exhibit about the observatory. What ends is more than a building: more than half a century of solar science from a machine that, for a long stretch, was the best in the world at what it did.

The post After more than 50 years, a solar telescope in New Mexico is being pulled down, after liquid mercury from the bearing that let its 250-ton optical system turn was found inside the tower. Crews found the metal on January 5. appeared first on Space Daily.

  •  

Between 1989 and 1997 the United States shipped more than 50 million pet turtles abroad, and enough of the red-eared sliders were later dumped in ponds and rivers when they grew too big that the species now outcompetes native turtles on every continent but Antarctica, listed among the 100 worst invaders on Earth.

The story begins with a cartoon. In late 1987 a low-budget animated series called Teenage Mutant Ninja Turtles began airing on American children’s television, and within eighteen months it had become the most successful children’s franchise of its decade. Sales of turtle-themed toys, lunchboxes, video games, and Halloween costumes went through the roof. And so did sales of actual pet turtles. American reptile farms, most of them clustered along the Mississippi River basin where the red-eared slider is native, ramped up production to meet the demand. Hatchlings the size of a fifty-cent piece were shipped by the tens of millions to pet stores across the United States and around the world.

What almost nobody selling the turtles bothered to mention was that a hatchling red-eared slider grows into an adult red-eared slider weighing up to three kilograms, requiring a hundred-gallon tank with filtration, and living for forty years or longer. Within a few years, unwanted adult sliders started turning up in ponds, rivers, and public parks in countries where the species had never existed before.

How 52 million turtles left the country

According to the International Union for Conservation of Nature’s Global Invasive Species Database entry on Trachemys scripta elegans, compiled by the IUCN Species Survival Commission’s Invasive Species Specialist Group and citing the original Telecky 2001 tally of the United States pet turtle export trade, more than 52 million red-eared sliders were exported from American turtle farms to overseas pet markets between 1989 and 1997. The primary destination was China, though large numbers also went to Japan, Taiwan, Thailand, South Korea, and Singapore, along with substantial shipments to France, Spain, Italy, Germany, the United Kingdom, Australia, South Africa, and Brazil. The reason American farms could produce sliders at that scale was that the species is remarkably easy to breed in captivity. The reason they were so easy to ship was that a hatchling turtle weighs almost nothing and can be packed into ventilated boxes by the hundreds.

The European Union, watching this happen in real time, banned the import of Trachemys scripta elegans on 22 December 1997. That single regulatory decision effectively ended the American export trade to Europe overnight. By the time it came into effect, however, the damage across the European continent was already done. Feral populations had established themselves in France, Spain, Italy, Portugal, Slovenia, Greece, Germany, Austria, Switzerland, the Netherlands, Belgium, Poland, Latvia, and the United Kingdom. Similar populations were showing up in the wetlands of every country the trade had reached. The turtles that had already been sold were still alive. Their owners were still tiring of them. The ponds behind their houses were still available.

If our animal kingdom fascinates you, you’ll enjoy this video we made on the recorded adventure of a young elephant bull, and what his route revealed: 

What happens when a tank turtle meets a lake

The red-eared slider turns out to be an unusually well-equipped invader. It reaches sexual maturity in three to four years, which is faster than most native freshwater turtles it competes with. Females can lay up to six clutches per year of up to thirty eggs each, giving the species a reproductive rate roughly two or three times higher than the European pond turtle it is now displacing across much of the continent. Adults tolerate a wide range of water conditions, from clean rural rivers to heavily polluted urban canals. They are omnivorous and will eat almost anything a freshwater environment can offer. They are aggressive at basking sites and will physically displace smaller native turtles from the sunning logs they need for thermoregulation.

The competitive dynamic has been most extensively studied in France, where researchers from the University of Paris-Sud have been documenting the interaction between introduced sliders and the native European pond turtle (Emys orbicularis) for the past two decades. What they have found is that in ponds where sliders are present, the native pond turtles are pushed to lower-quality basking sites, tend to survive at lower rates, and produce fewer offspring per breeding season. The European pond turtle is classified as Near Threatened on the IUCN Red List. Every additional slider in a European wetland adds to the pressure. Similar competitive displacement has been documented in Washington State against the Pacific pond turtle, in Australia against native short-necked turtles, and across Asia against a dozen freshwater species that had evolved in the absence of anything resembling a Mississippi-basin generalist.

According to The Nature Conservancy’s 2019 Cool Green Science article on American species invading other countries, written by staff science journalist Justine E. Hausheer, the geographic reach of the red-eared slider now covers essentially every continent where freshwater habitat and moderate temperatures exist. Established feral populations have been confirmed in the western United States, Australia, New Zealand, Europe, Great Britain, South Africa, the Caribbean, the Middle East, Southeast Asia, and several Pacific island groups. Only Antarctica remains slider-free, and even that exemption is only because Antarctica has no freshwater ponds and does not get above freezing for most of the year. If it did, and it had ponds, the sliders would probably be there too.

The IUCN Species Survival Commission’s Invasive Species Specialist Group formally listed the red-eared slider on the Global Invasive Species Database’s roster of the hundred worst invasive species anywhere in the world. The species now ranks number 93 on that list. It sits alongside brown rats, feral cats, cane toads, and the emerald ash borer as a species whose global spread has caused measurable and lasting ecological harm. Australia’s Vertebrate Pests Committee has assigned it a threat category of EXTREME. Multiple European countries have banned its sale, its keeping as a pet, or both. Illegal shipments continue anyway. Buddhist mercy ceremonies in parts of East Asia continue to release captive-bred sliders into rivers as an act of religious devotion, unaware or unbothered that the specific animal being released is an invasive species that will outcompete the native turtles the ceremony was originally designed to protect.

What the whole episode represents is one of the more improbable ecological consequences of a late-1980s children’s television programme. The Ninja Turtles cartoon ran for ten years. American reptile farms produced tens of millions of live turtles to meet the resulting demand. The turtles grew larger than their owners expected. The owners released them into the nearest available water. And forty years later, a native North American reptile that once occupied the freshwater ponds of a few states along the Gulf Coast now occupies almost every freshwater pond on the planet warm enough to support it. The turtles never asked to be there. They just weren’t given much choice. And once they arrived, they turned out to be remarkably well-suited to staying.

The post Between 1989 and 1997 the United States shipped more than 50 million pet turtles abroad, and enough of the red-eared sliders were later dumped in ponds and rivers when they grew too big that the species now outcompetes native turtles on every continent but Antarctica, listed among the 100 worst invaders on Earth. appeared first on Space Daily.

  •  

Astronauts on the space station have no washing machine, because water is far too precious to waste on laundry, so they wear the same clothes for days and then pack the dirty ones into a cargo capsule that burns up on reentry, which means a fireball crossing the sky could, in theory, be a bundle of an astronaut’s old underwear.

The International Space Station has been in continuous crewed operation since November 2000, which means somebody has been living roughly four hundred kilometres above the surface of the Earth every single day for the past twenty-five years without a break. During that time the station has been visited by more than two hundred and eighty astronauts and cosmonauts from more than twenty countries, and each of them has faced the same practical problem that any long-term resident of anywhere eventually has to solve.

Their clothes get dirty. And the space station, for reasons that come down to the physics of orbital resupply, does not have and has never had a washing machine on board. What NASA and the Russian space agency have therefore developed over the intervening decades is one of the more counterintuitive laundry solutions in any modern human institution. There is no laundry. The clothes go into a cargo capsule when the astronauts are done with them. The cargo capsule burns up on the way home.

Why nobody bothered to send a washing machine up

The reason is water. Aboard the space station every drop of water is a precious resource that either has to be lifted up from Earth at roughly $10,000 per kilogram in launch costs, or has to be extracted and recycled from the crew’s own urine, sweat and exhaled breath through a purification system that operates continuously in the background of station life. The station recycles roughly 90 per cent of the water it produces internally, which is considerably better than any comparable industrial recycling system on Earth. But even at that recycling rate, adding a washing machine to the water demand of the station would consume enough additional water per cycle to fundamentally change the economics of resupply. According to a 2017 VICE interview with Robert Trevino, a senior engineer with NASA’s Crew and Thermal Systems Division who is responsible for astronaut clothing on the station, the engineering team has been examining this question for years. NASA’s own internal trade studies compared the water and power requirements of a hypothetical station laundry system against the cost of simply replacing dirty clothes with fresh ones sent up on cargo runs. Replacing the clothes turned out to be cheaper. So that is what NASA does.

If space exploration fascinates you, you’ll enjoy this video we made on why astronauts come home feeling like they’re being watched…

What this means in practical terms is that astronauts on the station wear each piece of clothing for as long as it can reasonably be worn before it becomes unusable. Exercise clothes get roughly two weeks of use because the mandatory hour of daily exercise required to prevent bone and muscle loss in microgravity produces enough sweat to defeat the antibacterial coating on the fabric within a fortnight. Regular daily-wear clothes, meaning the cotton polos and cargo shorts that most station astronauts prefer, get anywhere between one and three months of wear per garment. Underwear rotation is up to the individual crew member. Trevino told VICE that former astronaut Don Pettit was known to have worn the same pair of shorts for months at a stretch, which was apparently a source of considerable amusement among his crewmates. The clothing is sourced by NASA’s contractor Lockheed Martin from ordinary commercial suppliers, including Lands’ End, Cabela’s, and Blackhawk. There is nothing technologically special about the fabric.

Where the clothes actually end up

Once a garment has reached the end of its useful wearing life, it goes into the station’s waste system alongside the packaging, food waste, expired equipment, and general trash that the crew generates every day. The waste is bagged, taped, and stored in whichever visiting cargo vehicle happens to be docked at the time. There are currently three different cargo vehicles that regularly deliver supplies to the station. Russia’s Progress capsule and Northrop Grumman’s Cygnus vehicle are both single-use, meaning they are launched from Earth full of supplies, unloaded at the station, refilled with trash, undocked, and then deliberately deorbited over the Pacific Ocean where they burn up in the upper atmosphere on the way down. SpaceX’s Dragon capsule is the exception. It is reusable, and it returns to Earth intact via parachute for a splashdown in the Pacific and eventual reuse on a subsequent mission. So while Dragon comes home in one piece, the trash from every Progress and Cygnus run ends up as a spectacular fireball crossing the sky somewhere in the upper atmosphere above the South Pacific.

According to Space.com’s November 2023 reporting by managing editor Brett Tingley on the reentry of the Russian Progress MS-23 cargo spacecraft, the reentry of a fully loaded trash-carrying capsule is a visually striking event. The Progress MS-23 undocked from the station on 29 November 2023 carrying, in the words of the Roscosmos cosmonaut Oleg Kononenko who saw it off, “old equipment and household waste, or everything the experts have decided to toss from the station.” Four hours later NASA astronaut Jasmin Moghbeli, who had been alerted by mission control to look out of a specific window at a specific time, was able to photograph the reentry from the ISS itself. Her photographs show what looks like a spectacular meteor. Bright trails of fire streak across the darkness of the upper atmosphere. The main capsule breaks apart into several distinct fragments as the atmospheric heating destroys its structural integrity. Then everything disperses into smaller and smaller sparks until nothing recognisable is left. Moghbeli wrote on X afterwards that the whole event lasted only two or three minutes and reminded her of fireworks.

What was inside the capsule during those two or three minutes was, among many other things, the accumulated clothing that seven astronauts and cosmonauts on the station had been wearing over the preceding several months. Somewhere in the fireball was Kononenko’s old exercise gear, along with the daily-wear cotton polos of the American, Japanese, and Danish crew members who had been aboard during the same period. Whether any of the specific garments in question had been observed by anyone on the ground as bright flashes in the night sky is impossible to say with certainty. But the fireball that briefly crossed the upper atmosphere above the South Pacific on the evening of 29 November 2023 did in fact contain, among its many other contents, the discarded underwear of at least seven people who had been living in low Earth orbit at the time.

Which is to say that the surprising claim in the title turns out to be more or less exactly what actually happens. The station has no washing machine. The clothes get worn until they can’t be worn any longer. They get packed into whichever cargo vehicle is next scheduled to depart. And the cargo vehicle, on its final trajectory back through the upper atmosphere, becomes a briefly visible streak of light in the night sky before the whole thing burns away to nothing over the Pacific Ocean. If you happen to be looking up at the right moment from the right latitude, and if you know the timing of the current Progress or Cygnus deorbit schedule, you might catch one. And what you would be watching, in the strict literal sense, is somebody’s old socks and shirts on their final journey home.

The post Astronauts on the space station have no washing machine, because water is far too precious to waste on laundry, so they wear the same clothes for days and then pack the dirty ones into a cargo capsule that burns up on reentry, which means a fireball crossing the sky could, in theory, be a bundle of an astronaut’s old underwear. appeared first on Space Daily.

  •  

In 1984, NASA left a satellite carrying 57 experiments in orbit for a planned 10 months — repeated delays stretched the trip to 69 months before Columbia brought the entire laboratory home inside its cargo bay, its exposed surfaces weathered by years in space.

The experiment-covered Long Duration Exposure Facility held by the shuttle robotic arm above Columbia’s payload bay

When NASA deployed the Long Duration Exposure Facility in April 1984, its experiments were supposed to spend about ten months in orbit before returning to Earth. Instead, scheduling changes and the aftermath of the Challenger accident extended the flight to 69 months. Columbia finally collected the facility in January 1990 and carried it home in its payload bay.

The satellite held 57 experiments. Its name, usually shortened to LDEF, described the job: expose materials and equipment to space, then bring them back for examination. The unexpectedly long stay made recovery more urgent while also providing an unusually extensive record of what the orbital environment could do.

A laboratory whose exterior was part of the experiment

LDEF was an uncrewed structure built to travel to and from orbit inside a space shuttle. A NASA mission profile describes a facility roughly nine metres long and 4.3 metres across, passively stabilised so its surfaces retained a consistent orientation relative to its direction of travel.

That orientation was scientifically useful. Materials facing into the direction of motion did not receive the same exposure as those facing away. A sample’s location was therefore part of the experiment, alongside its composition and the length of time it spent outside.

The structure carried test specimens in trays. Some investigations concerned the space environment itself; others asked how materials, components or systems would respond to prolonged exposure. The facility did not need a crew working inside it to function as a laboratory.

Its surfaces were recording the journey.

Returning those surfaces allowed scientists to study changes that could not be fully understood from a photograph alone. They could examine the actual material, compare exposed and protected areas, and connect physical damage with where each specimen had flown.

A retrieval delayed more than once

NASA’s history of the STS-32 recovery mission traces the postponements. Retrieval was originally assigned to a flight in February 1985. Shuttle scheduling delays pushed it to September 1986, and the Challenger accident brought another, much longer interruption.

By the time Columbia was preparing to collect LDEF, its orbit was decaying. NASA’s retrospective says trajectory specialists expected atmospheric re-entry by March 1990, making a timely recovery important. An object designed to be returned for analysis could otherwise lose both its hardware and much of its scientific value.

The long delay should not be mistaken for a planned six-year exposure campaign. It changed the experiment’s conditions after launch. More exposure could reveal long-term effects, but it also meant investigators had to interpret results against a mission history different from the one they had prepared for.

Nor did every instrument necessarily record continuously for the entire stay. The physical exposure of a specimen and the recording lifetime of an active instrument are separate things.

Columbia brought back the whole facility

On 12 January 1990, Columbia’s crew retrieved LDEF. Bonnie Dunbar operated the shuttle’s robotic arm, and the astronauts carried out a photographic survey before securing the facility in the cargo bay. Columbia landed at Edwards Air Force Base on 20 January.

A post-flight technical report records 32,422 orbits during the extended mission. Once the facility was back on Earth, work shifted from catching a satellite to systematically documenting and removing its experiments.

That transition was essential. Recovery was the route to the measurements, not the end of them. Trays had to be identified and examined in relation to their positions on the structure, while investigators distinguished environmental effects from other possible changes.

A spacecraft that returns as cargo offers a different scientific opportunity from one that transmits readings and stays aloft. The sample itself remains available for instruments, techniques and questions that may go beyond the original flight equipment.

Weathering in space has several causes

NASA’s overview of LDEF lists micrometeoroids, orbital debris, energetic particles, atomic oxygen and solar radiation among the exposures the experiments encountered. Calling the surfaces weathered is useful shorthand, but this was not terrestrial weather acting on an abandoned machine.

Atomic oxygen is one particularly important part of low Earth orbit. NASA’s materials research explanation describes how these reactive oxygen atoms can erode polymers on spacecraft surfaces. Their cumulative effects matter when engineers choose materials intended to remain outside for years.

Research from LDEF experiment A0114 included measurements of oxidation and polymer erosion, using the returned samples to investigate how surfaces interacted with fast oxygen atoms. Such measurements turned visible wear into evidence about rates and mechanisms.

The damage was part of the data.

Different materials could respond differently, and a surface’s appearance could not by itself identify every process involved. The value lay in combining inspection with measurements and the known exposure history.

The extended stay left an engineering reference

A 1994 overview of LDEF results describes more than 10,000 test specimens and the work of investigators studying the returned hardware and recorded data. The findings helped refine models of radiation, debris, meteoroids and atomic oxygen in low Earth orbit.

That is the broader importance of the mission. A laboratory test on Earth can isolate a particular effect, but an orbiting specimen encounters several influences together. Returned hardware allows researchers to compare their predictions with the combined result.

LDEF’s unusually long stay was an operational complication that became a source of scientific evidence. Columbia did more than retrieve an overdue satellite: it delivered years of exposure back to the laboratories equipped to examine it, with the marks of that history still on the surfaces.

The post In 1984, NASA left a satellite carrying 57 experiments in orbit for a planned 10 months — repeated delays stretched the trip to 69 months before Columbia brought the entire laboratory home inside its cargo bay, its exposed surfaces weathered by years in space. appeared first on Space Daily.

  •  

The second man to walk on the Moon later dug out his old expense claim from the trip, and it turns out Buzz Aldrin was reimbursed the grand sum of 33 dollars and 31 cents, not for the rocket or the spacecraft, but for the ordinary travel expenses of getting himself to and from the launch site like any other business trip.

The Apollo 11 mission cost NASA more than twenty billion dollars in 1969 money, or somewhere north of one hundred and fifty billion dollars in modern terms. It was one of the most expensive single scientific undertakings in human history, involving roughly four hundred thousand people across NASA and its contractor network. Everything about it was unprecedented. The Saturn V rocket had never been flown with a crew on a full lunar trajectory before. The Lunar Module had never been landed on a celestial body. The re-entry profile at the return end of the trip had never been survived. Buzz Aldrin flew on the mission as the second of three crew members and walked on the lunar surface on 20 July 1969. He returned home four days later. And when he got back to Houston he filed a routine federal government travel expense claim like any other public employee returning from a work trip. It was for thirty-three dollars and thirty-one cents.

What the voucher actually itemises

Aldrin posted a photograph of the original voucher on Twitter on 30 July 2015 to mark the forty-sixth anniversary of the moon landing. According to CBS News reporting the following day by science journalist Amanda Schupak, the voucher covers the period from 7 July 1969 through to 27 July 1969, which is a week and a half before the launch through to three days after the splashdown. What follows is probably the strangest business trip itinerary in the history of American federal expense accounting. The listed points of travel are Houston, Texas to Cape Kennedy, Florida on 7 July, then Cape Kennedy to Moon on 16 July, then Moon to Pacific Ocean on 24 July, then Pacific Ocean to Hawaii the same day, and finally Hawaii back to Houston on 27 July. The mode of transport listed for each leg is equally striking. Government Air for the two flights inside the continental United States. Government Spacecraft for the leg between Cape Kennedy and the Moon. USS Hornet, which is the aircraft carrier that recovered the crew, for the leg between the Pacific Ocean and Hawaii. And a US Air Force plane for the return to Houston.

The life of an astronaut is truly fascinating – check out the video we made on what every astronaut sees in the mirror:

The federal expense reimbursement system in 1969 did not distinguish between astronauts and any other government employee. If you were travelling on official business you filled out the same form, listed the same route, claimed the same mileage rate for personal vehicle use, and provided the same receipts for any out-of-pocket costs. Aldrin’s voucher was processed by a routine NASA finance office alongside vouchers from technicians attending conferences and administrators travelling to Washington. Nobody appears to have thought the situation odd enough to route it through any special channel. The reimbursement was paid in the normal course of business a few weeks later.

Why the amount was so small

The reason the total came to only thirty-three dollars and thirty-one cents rather than something more substantial is spelled out on the voucher itself. According to BBC Science Focus Magazine’s August 2015 write-up by Rachel Baxter, the document states in plain text that government meals and quarters were furnished for all the dates in question. That covered his food and lodging at the pre-launch quarantine facility at Cape Kennedy, aboard the Saturn V and the Apollo capsule, on the lunar surface itself, aboard the USS Hornet during the post-splashdown recovery, and inside the mobile quarantine facility where he and Neil Armstrong and Michael Collins were confined for twenty-one days after their return in case they had brought back any unknown lunar pathogens. The federal government had covered every one of those things directly, so Aldrin had nothing to claim against any of them.

What the thirty-three dollars and thirty-one cents actually covered was almost certainly the mileage rate for driving his own personal vehicle from his home in Houston to Ellington Air Force Base and back at each end of the trip. Government employees in 1969 were entitled to claim a per-mile rate when using their own car for official business. Aldrin did what everybody at NASA did. He drove to the airfield, got on the government plane, and came home the same way at the end. He submitted his mileage on the standard form. He got his check for thirty-three dollars and thirty-one cents in the mail a few weeks later.

The voucher was not the only piece of Apollo 11 bureaucratic paperwork Aldrin dug out and shared publicly in 2015. He also posted the US Customs declaration that he and Armstrong and Collins had signed on landing in Honolulu after the recovery. The declaration listed their country of departure as Moon and their flight number as Apollo 11. The cargo section listed moon rock and moon dust samples. The question about whether any crew member had been in contact with an infectious disease during the trip was answered by Aldrin in the space provided as “moon disease TBD.” A Honolulu customs inspector had counter-signed the form and accepted it as filed. The crew had cleared customs.

What the whole set of documents represents is one of the more revealing curiosities of the entire Apollo programme. NASA had achieved something in July 1969 that no human institution had ever previously come close to achieving, and the federal bureaucracy processing the paperwork for the people who had done it treated them exactly like every other federal employee returning from a work trip. That was partly because the routine forms were the only ones available. But it was also because the people at NASA didn’t consider themselves exempt from the ordinary paperwork obligations of federal employment. Aldrin filled out his expense form. He submitted his customs declaration. He collected his thirty-three dollars and thirty-one cents. And forty-six years later he still had the voucher in a drawer.

The post The second man to walk on the Moon later dug out his old expense claim from the trip, and it turns out Buzz Aldrin was reimbursed the grand sum of 33 dollars and 31 cents, not for the rocket or the spacecraft, but for the ordinary travel expenses of getting himself to and from the launch site like any other business trip. appeared first on Space Daily.

  •  

More than 2,500 retired New York subway cars were dropped into the Atlantic between 2001 and 2010, not as illegal dumping but as a planned reef programme, and marine biologists who kept watch found the sunken trains quickly turned into some of the richest artificial habitats along the eastern seaboard.

The Metropolitan Transportation Authority, which runs the New York City subway system, had a problem in the late 1990s. It was in the middle of a major fleet modernisation programme that was going to retire roughly two and a half thousand ageing subway cars over the following decade. These were mostly the red-painted R-33 and R-36 cars that generations of New Yorkers had ridden through the 1970s, 80s and 90s, followed by the older stainless steel Brightliners that would come off the tracks later. Each retired car was worth essentially nothing as scrap. Each also cost the MTA roughly twelve thousand dollars to dispose of through conventional demolition. Which meant the total disposal bill for the fleet retirement, at prevailing rates, was going to run to something north of thirty million dollars. And the MTA, being a public transit authority in a permanent state of budget crisis, was not enthusiastic about that particular expense.

The solution the agency arrived at, in partnership with a handful of coastal state governments and the U.S. Fish and Wildlife Service, was one of the more counterintuitive recycling programmes of the early twenty-first century. Instead of paying to demolish the cars, the MTA would clean them, ship them south by rail and barge, and drop them into the ocean off the eastern seaboard. There they would form artificial reefs. The states would get new marine habitat for essentially free. The MTA would save the disposal costs. And the fish would, in theory, work out what to do with the rest.

How you turn a subway car into a reef

According to the New York Transit Museum’s own summary of the MTA Artificial Reefing Program, produced in collaboration with the programme’s former director Michael Zacchea and Robert Martore of the South Carolina Department of Natural Resources, the operation ran from August 2001 through to April 2010 and deployed more than 2,500 deaccessioned train cars to underwater sites off the coasts of New Jersey, Delaware, Virginia, South Carolina, and Georgia. The first phase concentrated on the Redbird fleet, which was already being pulled off the tracks in 2001, and which had a particularly recognisable red livery that made the sunken cars a photographable subject long after they had gone down. The Delaware Bay took approximately six hundred and nineteen Redbird cars alone, at a site now known as the Redbird Reef, located sixteen and a half nautical miles off Indian River Inlet at a depth of around eighty feet. Subsequent phases involved the stainless steel Brightliner fleet, which was deployed at reef sites further down the coast through the second half of the decade.

The engineering of the actual reef deployment was not trivial. Each car had to be stripped down first. According to the New Jersey Division of Fish and Wildlife’s own news bulletin on the deployment of 44 stainless steel subway cars at the Atlantic City Reef site in April 2008, every car went through a full preparation process before it went into the water. Windows were removed. Wiring was pulled out. Plastic components, degradable materials, hydraulic fluids, oils, and grease were all stripped or drained. The remaining shell was inspected to make sure that when the car eventually corroded, nothing toxic would leach into the surrounding marine environment. Only after that inspection was the cleaned steel body loaded onto a barge and towed offshore.

The actual sinking process was almost comically straightforward. The cars, weighing around eighteen tonnes each in their prepared state, were rolled off the deck of the barge by a hydraulic tipping mechanism and simply dropped through the water column to the seabed below. The MTA covered all of the cleaning, transport, and deployment costs. Individual cars in the New Jersey deployment measured roughly sixty feet long, ten feet wide, and eleven feet tall. Deployed in tight clusters at pre-selected coordinates, they formed roughly the same kind of hard-structure habitat that a natural rocky reef would offer, but at a scale and geometry that had never previously existed on the sandy Atlantic continental shelf.

What the fish did with them

What happened next surprised the marine biologists monitoring the sites, though it probably shouldn’t have. The subway car reefs, unlike almost any natural feature of the mid-Atlantic seabed, offered vertical structure. They offered cavities and shelter. They offered hard surfaces for sessile organisms to colonise. And they were essentially unlimited in supply. Marine invertebrates began settling on the exposed steel within weeks. Barnacles arrived. Blue mussels followed. Sponges and soft corals began to establish themselves on the vertical surfaces. Within a year or two, the once-bare metal shells of the retired subway cars had become the physical scaffolding of thriving benthic communities that had not existed anywhere on that stretch of ocean floor beforehand.

The fish arrived in response. Delaware’s Department of Natural Resources and Environmental Control has since documented that the invertebrate communities colonising the artificial reef structures provide up to four hundred times more food per square foot than the bare sandy ocean floor they replaced. Species that had been effectively absent from the region because of the lack of suitable habitat began to appear regularly at the sites. Sea bass, tautog, tuna, mackerel, flounder, scup, and triggerfish were all documented in significant numbers within a few years of the deployments. Recreational fishing operators in the coastal towns of Delaware, New Jersey, and Virginia found their nearshore catches rising. Dive operators found themselves with a genuinely unusual attraction to offer. The sunken subway cars, which had cost the MTA nothing to dispose of and had cost the states essentially nothing to acquire, became one of the more productive artificial reef complexes anywhere on the North American Atlantic coast.

The programme was not without complications. Inspection reports from New Jersey in 2009 found that some of the newer stainless steel subway cars were showing significant structural damage after only a few years underwater, which prompted the state to pause further stainless steel deployments while investigations continued. Not every car remained intact. Not every deployment site delivered the ecological returns the biologists had hoped for. And the specific question of whether artificial reefs simply concentrate existing fish populations rather than creating new ones is still debated within the marine biology community. But the general pattern held across the majority of the deployment sites through the 2010s and 2020s. The bare sand became structured habitat. The structured habitat became invertebrate communities. The invertebrate communities became feeding grounds. And the feeding grounds became fisheries.

By the time the programme officially ended on Earth Day 2010, 2,580 New York subway cars had been placed on ocean reef sites along the eastern seaboard of the United States. The MTA had saved something close to thirty million dollars in disposal costs. Delaware alone had received nearly a thousand of them. The Redbird Reef off Slaughter Beach now covers roughly 1.3 square miles of what used to be featureless sand and is one of the most biologically productive stretches of continental shelf in the entire mid-Atlantic region. Which is a strange kind of legacy for a fleet of subway trains that once carried millions of people through the tunnels underneath Manhattan and Queens. The trains never made it to the recycling yard. They made it to the ocean floor instead. And the fish have been living in them ever since.

The post More than 2,500 retired New York subway cars were dropped into the Atlantic between 2001 and 2010, not as illegal dumping but as a planned reef programme, and marine biologists who kept watch found the sunken trains quickly turned into some of the richest artificial habitats along the eastern seaboard. appeared first on Space Daily.

  •  

Four fixed half-pipe reflectors in British Columbia, each 100 meters long and strung with 1,024 antennas, watched the same overhead strip of sky from July 25, 2018 to September 15, 2023 and logged 4,539 fast radio bursts from 3,641 separate sources, on a telescope that cannot be aimed.

A telescope with no moving parts, stationed in the mountains of British Columbia, has produced the largest single accounting of fast radio bursts ever assembled. The Canadian Hydrogen Intensity Mapping Experiment (CHIME) and its FRB collaboration have released a second catalog logging 4,539 fast radio bursts from 3,641 distinct sources, drawn from more than five years of continuous sky-watching between July 25, 2018, and September 15, 2023.

The result, posted to arXiv in January 2026 and published in The Astrophysical Journal Supplement Series, supersedes the collaboration’s first catalog, which covered a single year of observations ending in mid-2019 and recorded 536 bursts. The new release spans roughly five times the observing period and delivers more than eight times as many detected events, cementing CHIME’s role as the dominant instrument for cataloging these millisecond-long flashes of radio energy.

A telescope that cannot look anywhere else

CHIME’s design is unusual for an instrument that has become the world’s leading fast radio burst detector. Located at the Dominion Radio Astrophysical Observatory near Penticton, British Columbia, it consists of four stationary half-pipe reflectors, each 100 meters long and 20 meters wide, laid side by side and oriented north-south. ICHIME has no moving parts at all — unlike dishes that swivel to track a target. Each cylinder’s focal line is strung with 256 dual-polarization antennas, for 1,024 across the array, feeding a digital signal-processing system that forms 1,024 beams electronically rather than through any physical steering.

That fixed geometry means CHIME cannot be aimed at a particular patch of sky the way a conventional radio dish can. Instead, it watches a roughly 200-square-degree strip of sky directly overhead and lets Earth’s rotation carry the rest of the northern sky through its field of view over the course of a day. The technique, known as transit observing, trades the ability to target specific objects on demand for near-continuous coverage of a wide swath of sky, night and day — precisely the kind of monitoring that catching rare, unpredictable millisecond bursts requires.

What changed since the first catalog

The collaboration’s first catalog, released in 2021, logged just over 500 bursts from a single year of data. That release established CHIME as a serious FRB survey instrument and provided the first large, uniformly selected sample for statistical study. The new catalog is a different scale of effort entirely: it folds in more than four additional years of observing time, past the original one-year window, and pushes the source count past 3,600 — a population increase that lets researchers move from spotting a phenomenon to characterizing it as a class.

Fast radio bursts are intense pulses of radio waves lasting typically a few milliseconds, first identified in archival data in 2007 and confirmed as an astrophysical population in the years since. Most detected bursts appear to flash once and never repeat from the same location, but a minority repeat, sometimes many times, from sources that can be pinpointed to host galaxies. Among the 4,539 bursts in the new catalog, 981 come from 83 known repeating sources, while the remainder appear as one-off events, at least within the observing window. That repeater fraction, drawn from a sample nearly nine times larger than before, gives researchers a substantially firmer basis for comparing the properties of repeating and apparently non-repeating bursts, including their durations, frequency structure, and the dispersion imposed on the signal as it crosses intervening plasma on its way to Earth.

Why the larger sample matters

The physical origin of fast radio bursts remains only partly settled. Magnetars — neutron stars with extraordinarily strong magnetic fields — are the leading candidate source for at least some bursts, following the 2020 detection of a burst from a magnetar inside the Milky Way. But the diversity of burst durations, brightness, and repetition behavior recorded across thousands of events suggests more than one physical mechanism, or more than one class of source, may be responsible. Larger, more uniform catalogs let researchers test that diversity statistically rather than relying on a handful of well-studied individual sources.

Because each burst’s radio signal is dispersed — delayed by different amounts at different frequencies as it passes through free electrons in space — the catalog also functions as a probe of matter distributed between galaxies. That diffuse, low-density gas is difficult to detect by any other means, and a sample of thousands of bursts at known or estimated distances allows astronomers to map its distribution across large volumes of the universe, an application sometimes described as using fast radio bursts to weigh the cosmos.

The catalog paper reports each burst’s arrival time, dispersion measure, scattering timescale, and flux density, along with a dynamic spectrum across the 400–800 megahertz band CHIME observes, at just under a millisecond time resolution. That level of detail, applied uniformly across thousands of bursts rather than compiled from disparate instruments and detection methods, is what distinguishes a catalog release from a series of individual discovery announcements.

What comes next

CHIME/FRB’s outrigger stations — companion antenna arrays built at separate sites across North America — extend the core telescope’s ability to localize individual bursts to their host galaxies with far greater precision than CHIME alone can achieve, a capability that has already been applied to a subset of local-universe bursts drawn from the same multi-year dataset. As those outriggers accumulate their own detections alongside the main array, the size and precision of future catalogs are expected to grow further, sharpening the statistical picture the second catalog has already begun to draw.

The post Four fixed half-pipe reflectors in British Columbia, each 100 meters long and strung with 1,024 antennas, watched the same overhead strip of sky from July 25, 2018 to September 15, 2023 and logged 4,539 fast radio bursts from 3,641 separate sources, on a telescope that cannot be aimed. appeared first on Space Daily.

  •  

Physicist Bhupal Dev at Washington University used the debris from GW170817 — the 2017 neutron star merger — to squeeze new limits on axion-like particles, treating the hot post-collision remnant as a natural forge for dark-matter candidates

Physicist Bhupal Dev at Washington University used the debris from GW170817 — the 2017 neutron star merger — to squeeze new limits on axion-like particles, treating the hot post-collision remnant as a natural forge for dark-matter candidates

For about one second after two neutron stars collided 130 million light-years away, the wreckage they left behind was hotter than anything else in the observable universe. Bhupal Dev, a physicist at Washington University in St. Louis, and four collaborators asked what that one second would have manufactured if a hypothetical particle called an axion-like particle exists — and then went looking for the light it should have left behind.

Nothing arrived. The shape of that absence is the result.

What GW170817 actually was

On 17 August 2017, the LIGO and Virgo detectors recorded a gravitational-wave chirp lasting roughly 100 seconds, the longest signal captured to that point. About 1.7 seconds later, NASA’s Fermi Gamma-ray Burst Monitor caught a short gamma-ray burst from the same patch of sky. The coincidence is documented in the collaboration’s multi-messenger paper in The Astrophysical Journal Letters.

Less than eleven hours after the merger, the one-metre Swope Telescope in Chile pinned the source to NGC 4993, a lenticular galaxy about 40 megaparsecs — roughly 130 million light-years — away. Within a day, dozens of observatories were watching a fading point of light that astronomers had spent decades predicting and never seen: a kilonova.

Two neutron stars had spiralled into each other, each somewhere between about one and two times the mass of the Sun, each compressed into an object about the size of a mid-sized city. When they touched, the collision briefly produced conditions denser and hotter than anywhere else in the observable universe.

neutron star merger illustration

ESO’s telescopes in Chile tracked the afterglow across a wide range of wavelengths, and the observatory’s October 2017 announcement of the first visible counterpart to a gravitational-wave source reported spectra suggesting caesium and tellurium in the ejecta. Two years later, a separate analysis of VLT X-shooter data pinned down strontium, the first individual heavy element identified in a neutron star collision. Some of the gold in a wedding ring was made in events like this one.

Why the remnant is a particle factory

Before they merge, neutron stars are cold by particle-physics standards — thermal energies around a kilo-electron-volt. The collision changes that within milliseconds. Temperatures in the remnant climb into the tens of MeV, and the benchmark merger profile Dev’s group used exceeds 50 MeV in places, roughly 600 billion degrees. Production rates for weakly coupled particles rise steeply with temperature. Whatever exists in the right mass window gets made.

Axion-like particles, or ALPs, are among the most-hunted candidates. They are cousins of the axion — the particle implied by the Peccei-Quinn mechanism proposed in 1977 to resolve a puzzle in the strong nuclear force, and named the following year by Weinberg and Wilczek. ALPs relax the axion’s strict relationship between mass and coupling, and they appear generically in string theory and in many extensions of the standard model.

The catch is that they interact with ordinary matter so feebly that laboratory experiments struggle to reach the parameter space that matters. Which is where dead stars come in.

How the bound actually works

The property Dev’s group targeted is the ALP’s coupling to photons. In the hot, dense matter of the remnant, two processes make ALPs: the Primakoff process, in which a photon scattering off a proton converts into an ALP, and photon coalescence, in which two photons merge into one. Primakoff dominates at low masses, coalescence at high ones, with the switchover around 100 MeV.

What happens next is the whole argument. ALPs stream out of the remnant — those with enough kinetic energy to climb out of its gravitational well, at least — and then decay back into pairs of photons well outside the debris. The team required decays beyond about 1,000 kilometres, far enough that the emitted photons would not simply be reabsorbed by the ejecta. The result would be a gamma-ray signal arriving roughly along the line of sight to the merger, offset in time from the gravitational waves by the geometry of where each ALP happened to decay.

Fermi-LAT was watching. It missed the prompt burst, but it collected data in the window from 1,153 to 2,027 seconds after the gravitational-wave signal, across 0.1 to 1 GeV, and saw nothing above a flux upper limit of 4.5 × 10⁻¹⁰ erg per square centimetre per second at 95% confidence. Every combination of ALP mass and photon coupling that would have produced a brighter signal than that is excluded. The preprint sets out the full calculation, including the decay geometry and the in-medium photon physics.

That is the first constraint of its kind derived from a merger, as the university’s announcement of the work noted. Two representative points in the newly excluded region sit at masses of 200 and 398 MeV. Worth being precise about what this is not: it is not a cooling argument. The team explicitly checked that across the parameter space they constrain, ALP emission does not drain enough energy to alter how the remnant cooled.

What the bound covers, and what it does not

The GW170817 exclusion is weaker than the long-standing limit from Supernova 1987A, and the reason is geometry rather than physics. Photon flux at Earth falls off with the square of the distance to the source. A supernova in the Large Magellanic Cloud is far closer than a merger at 40 megaparsecs, so it delivers more photons even from an identical ALP population.

What the merger offers instead is timing. The arrival of the gravitational-wave signal defines a clean zero point, which supernovae generally lack — for SN 2023ixf, no neutrino signal was detected at all. Combining spectral and temporal information from a merger, the authors argue, is where this method becomes competitive, particularly for observations inside the first second.

The constraint is also more robust than the article’s underlying uncertainties might suggest. GW170817’s remnant is thought to have survived about a second before collapsing to a black hole; varying that assumed lifetime between 0.72 and 1.29 seconds barely moves the exclusion region, and the result depends only weakly on which of nine merger profiles is used.

None of this detects anything. It tells you what an ALP cannot be, given that GW170817 behaved the way it did. And the dark matter question is separate again: an ALP in this mass range could in principle be a dark matter component, but a production bound from one merger says nothing about cosmological abundance. It shrinks the box. It does not confirm anything is in it.

The source that keeps giving

The merger’s own story has kept moving independently of the particle physics. Chandra saw nothing when it first slewed to the target, then found a point source on 26 August 2017. That sequence — non-detection, then detection — was itself the clue. It indicated a narrow relativistic jet pointed away from Earth, whose emission only reached the detector once the jet slowed and widened into the line of sight.

Chandra X-ray observatory

Then the fading stopped. As the Center for Astrophysics reported in March 2022, Aprajita Hajela of Northwestern University and colleagues found that from March 2020 through the end of that year the X-ray brightness held roughly constant. Something besides the jet had taken over. The two candidates are a kilonova afterglow — a shock from the expanding debris — or matter falling onto a newly formed black hole. Either would be a first, and radio observations are the test: a kilonova afterglow should brighten in radio, accretion onto a black hole should not.

At the time of that release, Chandra was the only observatory still able to detect the source, more than four years after the collision.

Space Daily has covered other corners of the same search. A Rice University team has used a grain-of-sand-sized magnet levitated above a superconductor to hunt for ultraheavy dark matter, extending the search toward candidates approaching the mass of a living cell, according to the group’s own account of the experiment. That is the far end of the mass axis from the MeV-scale ALPs Dev’s group is bounding — a table-top instrument at millikelvin temperatures on one side, a collision 130 million light-years away on the other.

Using distant catastrophes as instruments

GW170817 remains the only confirmed binary neutron star merger with a full electromagnetic counterpart. LIGO and Virgo have caught other candidate neutron star events, but none produced the same multi-wavelength bounty, which is why the same dataset keeps being reprocessed for new physics. A 2021 review by Milton Ruiz, Stuart Shapiro and Antonios Tsokaros in Frontiers in Astronomy and Space Sciences surveys what relativistic simulations can now say about these events, including the consensus that GW170817’s remnant lasted under a second before collapsing.

A cleaner ALP constraint needs more mergers, or closer ones. The authors sketch both: a stacked analysis of several events, a hypothetical merger ten times nearer, and early observation windows starting a tenth of a second after the gravitational-wave trigger. Proposed MeV gamma-ray missions such as AMEGO-X and e-ASTROGAM would help considerably.

When that data arrives is unsettled. O4 ended on 18 November 2025, and the detectors have since been in upgrades and commissioning. According to the LIGO-Virgo-KAGRA observing plan, an interim six-month run is expected around late 2026, while the timeline for the fifth observing run remains under discussion.

The hot phase of the merger lasted about one second. The gravitational-wave chirp lasted about a hundred. Somewhere between those two numbers is a photon signal that never reached Fermi’s detectors — and the precise shape of that absence, how bright it wasn’t and how early it wasn’t, is what now fences off a corner of parameter space where a particle nobody has ever seen can no longer hide.

The post Physicist Bhupal Dev at Washington University used the debris from GW170817 — the 2017 neutron star merger — to squeeze new limits on axion-like particles, treating the hot post-collision remnant as a natural forge for dark-matter candidates appeared first on Space Daily.
  •  

On 28 October 1971, a British Black Arrow rocket put Prospero into orbit from the Australian desert — Parliament had been told on 29 July that the programme would end after this flight, leaving the next rocket to become an unflown museum exhibit.

A red dirt road stretching across a flat Australian outback landscape

Black Arrow’s successful orbital flight arrived after its future had already been decided. On 28 October 1971, the British rocket launched Prospero from Woomera, Australia. Three months earlier, Parliament had been told that the programme would end once that mission was complete.

The next vehicle, R4, never launched. Its eventual place in the Science Museum gives the story a physical ending: one rocket carried a satellite into orbit, while its successor became an object through which later generations could examine the programme.

The final flight was explicitly allowed

The written parliamentary answer of 29 July 1971 is unusually clear. Responding to a question about the National Space Technology Programme, Frederick Corfield confirmed plans to launch the X3 satellite later that year. He then stated that Black Arrow would be terminated after the launch.

That matters because it distinguishes an authorised final mission from a launch carried out in defiance of cancellation. The decision and the permission appeared in the same answer. The engineers could complete the flight, but a successful result was not accompanied by a promise of further launches.

Corfield’s stated rationale concerned resources and capability. Maintaining a national launcher with comparatively limited capacity, he argued, consumed too much of the available programme while restricting its broader scope. The answer also said satellite technology research would continue, with X4 planned for a NASA Scout launch in 1974.

The launcher was ending; satellite work was continuing.

A British vehicle launched from Australia

ESA’s historical account confirms the date, the Woomera launch site and Prospero’s alternative designation, X3. Black Arrow’s development had begun in 1964 under the Royal Aircraft Establishment. Its achievement was the delivery of a satellite by a British-developed launcher, not a launch from British soil.

That distinction is easy to lose in a compressed account of national space achievements. The origin of a rocket, the origin of its payload and the territory from which it flies are separate facts. Here, the Australian desert was part of the infrastructure that made the British programme possible.

A UK Space Agency retrospective describes the wider effort behind the vehicle: rocket and engine development, assembly and test facilities in Britain, and launch and range facilities at Woomera. Black Arrow drew on earlier Royal Aircraft Establishment research and technologies using high-test peroxide and kerosene.

The agency describes a three-stage rocket about thirteen metres tall, with an eight-chamber engine in the first stage and a solid motor in the third. Those modest dimensions can obscure the range of systems required to produce an orbital flight. A launch vehicle is also a programme of testing, ground support, control and integration.

R4 records the launch that did not happen

The Science Museum Group’s collection record for Black Arrow R4 identifies it as the final vehicle built, with minor assembly and pipework incomplete. Its intended satellite, Miranda, eventually went into orbit on an American Scout rocket in 1974.

R4 is therefore more than a representation of the rocket that flew. It is surviving hardware from the next step that the programme did not take. Its parts preserve engineering decisions even though they never experienced a launch.

The museum records four Black Arrow launches, two successful, including the flight that orbited Prospero. That is a short development history, and it invites competing readings: a capability achieved just as support ended, or a limited programme whose costs had to be weighed against other space priorities.

The records establish the sequence without settling every argument about the decision. A successful flight demonstrates that a particular mission worked. It does not, on its own, calculate the costs, demand or reliability of an extended operational service. Equally, a decision to stop funding that service does not undo the technical achievement.

Becoming an exhibit required another decision

A Science Museum Group Journal study of R4 follows the vehicle’s transition into a museum object. It describes discussions soon after Prospero’s launch, when the departments responsible for Black Arrow were working towards winding up the programme by the end of March 1972.

Acquiring the rocket involved practical arrangements, not simply declaring it historic. The article records an estimated £5,000 to prepare it for transfer, to be met by the Department of Trade and Industry, with the museum responsible for transport from the Isle of Wight to its west London store.

The preservation of a cancelled project is itself work. Large objects need space, handling equipment and decisions about what to retain. Without those choices, the next rocket might have survived only in drawings and photographs.

R4 became evidence that people could stand beside.

Success and continuation were different questions

Black Arrow’s ending is often compelling because the chronology seems reversed: the programme was told to stop, then achieved its orbital goal. But the parliamentary statement shows that both outcomes had already been accommodated. The final flight could proceed while the longer-term launcher commitment ended.

Space Daily’s account of Project West Ford’s orbiting copper needles describes another space experiment whose technical demonstration did not lead to an enduring operational system. The reasons differed, but both histories reward separating what hardware proved from what institutions chose to continue.

Prospero’s launch and R4’s preservation mark those two questions in different places. One was answered above the Australian desert in October 1971. The other left a rocket on Earth, retaining the shape of a next flight that never came.

The post On 28 October 1971, a British Black Arrow rocket put Prospero into orbit from the Australian desert — Parliament had been told on 29 July that the programme would end after this flight, leaving the next rocket to become an unflown museum exhibit. appeared first on Space Daily.
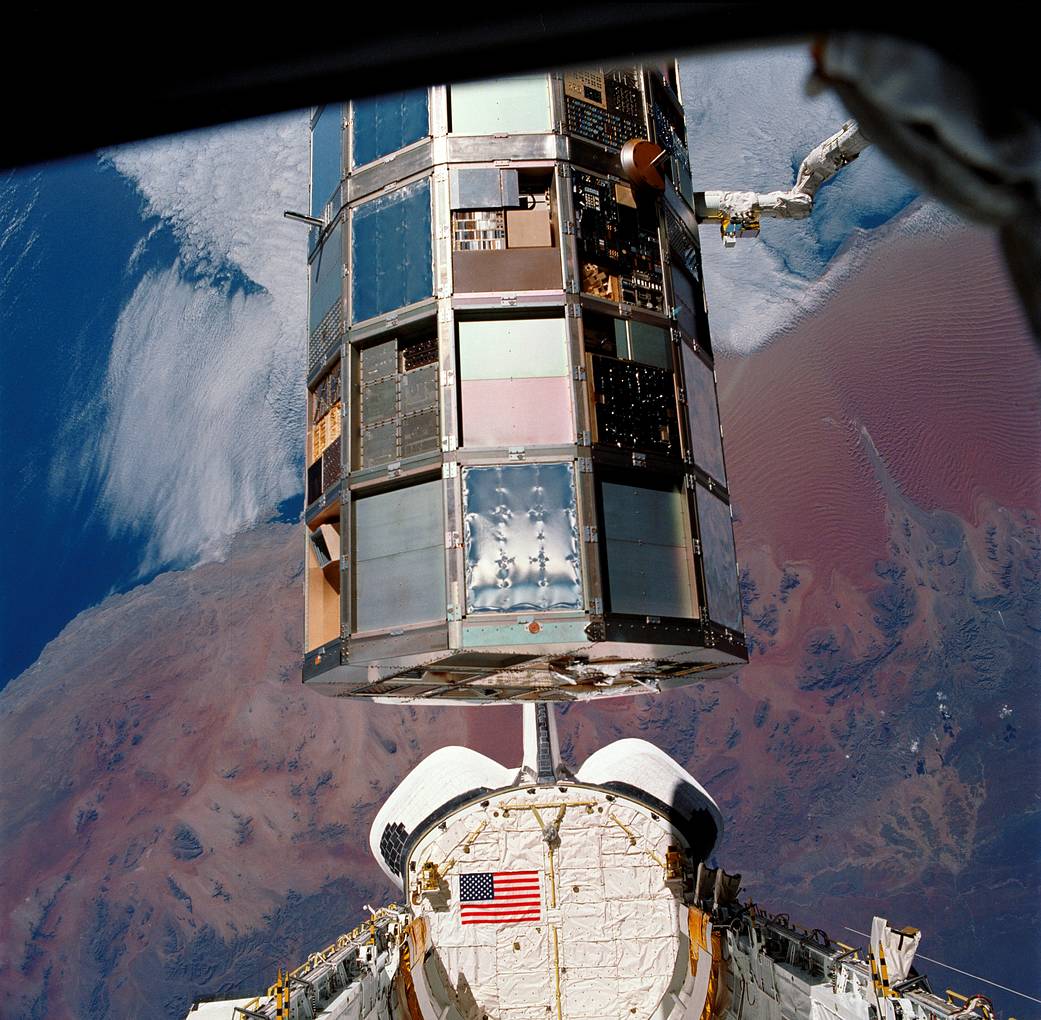
  •  

Cambridge researchers kept a computer chip running for a year using blue-green algae in a container about the size of an AA battery — the living power source harvested energy from light and continued supplying electricity through periods of darkness

A tube of pond scum on a Cambridge windowsill spent half a year running a computer, and nobody had to feed it.

The container held blue-green algae, water and very little else, and it was roughly the size of an AA battery. Inside it, a colony of microbes harvested light, leaked electrons into a strip of aluminium and produced a current steady enough to keep a microprocessor ticking over from February to August 2021. Smithsonian magazine reported that the whole apparatus sat out a pandemic lockdown on a windowsill in the home of Cambridge biochemist Paolo Bombelli.

It ran far longer than anyone on the project expected.

What was actually inside the container

Synechocystis is a cyanobacterium, one of the ordinary non-toxic pond dwellers that has been quietly photosynthesising for a couple of billion years. Photosynthesis splits water and sends the resulting electrons down an internal transport chain inside the cell. Some of that current leaks out before it is used, and a metal anode positioned nearby can catch it. Exactly how those electrons make the jump from a living cell to bare metal is still not settled.

Bombelli and his colleagues, writing in Energy & Environmental Science, described a small housing of clear plastic and steel with an aluminium anode inside, built from inexpensive and largely recyclable parts. No feeding, no charging. Cyanobacteria make their own food as they photosynthesise, so light and water cover the entire supply chain.

Stranger still, the current did not stop at sunset. Researchers on the team suspect the microbes carry on metabolising food banked earlier in the day, which is why the cell kept nudging out electricity through the dark hours, as the Cambridge Independent reported.

How little electricity this really is

Averaged across the experiment, the cell delivered about 1.05 microwatts at 0.72 volts, figures Gizmodo set against the obvious comparisons. A fresh AA battery starts life at 1.5 volts. An efficient LED globe pulls around 10 watts. So the device was generating something in the region of a ten-millionth of a globe.

That sufficed only because the chip had been picked for extreme frugality. An Arm Cortex M0+ can tick along on 0.3 microwatts, and Arm Research built the test chip, the board and the cloud link that logged everything the microbes did. Only the chip itself ran on that current. The cloud link, which reported the results back to the researchers, needed conventional power to do its job.

Devices of this kind hold one advantage over the better-known microbial fuel cell, which needs a steady diet of organic matter to keep its bacteria working. Researchers publishing in Nature Communications noted that biophotovoltaic systems skip that input altogether, since the cells feed themselves as they go. The fuel bill is nothing and the colony renews itself, roughly the combination a sensor buried in a paddock for a decade would want.

Why a microwatt earns a paper

Who needs a computer powered by pond water? Nobody, right now. The argument is about the enormous, boring category of devices that comes next: door sensors, soil monitors, tracking tags, all the small gadgets multiplying across the world. Forecasts in the same paper put the number of connected devices on a path towards a trillion by 2035, every one of them wanting its own portable trickle of electricity. Batteries go flat, and they depend on materials that are expensive and unpleasant to dig out of the ground.

Christopher Howe, the Cambridge biochemist who co-led the work, argued in the university’s announcement that supplying all that hardware will require systems that generate energy “rather than simply store it like batteries”.

What one windowsill proves

Six months of unbroken output went into the submitted paper, and the hardware simply carried on afterwards. The funders at the National Biofilms Innovation Centre later described the microprocessor as having run for a year and counting on nothing but ambient light and water.

A single device in a single house is a demonstration, and one paper is one paper.

Two things stand between this and anything resembling a product: a great deal more current, and some agreement on how to measure it. A review in Frontiers in Microbiology characterises biophotovoltaics as a field hobbled by very low current outputs and by experimental set-ups too inconsistent to compare with each other, which stalls any systematic push to improve them. No one has fully pinned down how electrons cross from a living cell into an electrode either, so progress tends to come from trying things and seeing what sticks.

Scaling up means manufacturing thousands of these cells cheaply and reliably, and doing it before anyone has fully worked out what is happening inside them.

The processor was disconnected a long time ago. By Bombelli’s account the algae carried on making electricity regardless, entirely indifferent to whether anything was still listening.

The post Cambridge researchers kept a computer chip running for a year using blue-green algae in a container about the size of an AA battery — the living power source harvested energy from light and continued supplying electricity through periods of darkness appeared first on Space Daily.
  •  

French, Russian, and German researchers thawed sediment from nine sites of Siberian and Kamchatkan permafrost and revived thirteen previously undescribed viruses, the oldest of them from ground beneath a Yakutian lake bed dated to more than 48,500 years, and the reason every one of the thirteen can infect nothing but amoebae is a decision the team made before the first sample went into the dish

Thirteen viruses that have not circulated on Earth since before the last Ice Age’s coldest stretch are now, technically, alive again. A team led by Jean-Michel Claverie and Chantal Abergel at Aix-Marseille University, working with Russian colleagues from the Melnikov Permafrost Institute and other institutions, and German permafrost scientists from the Alfred Wegener Institute, pulled the samples from nine locations across Siberian and Kamchatkan permafrost and coaxed the ancient particles back into active replication in a lab dish. The oldest, a giant virus the team named Pandoravirus yedoma, came from sediment more than 16 meters beneath a thermokarst lake at Yukechi Alas in central Yakutia, radiocarbon-dated to over 48,500 years old. The strange part is not any of that. It’s that every single one of the thirteen, across five separate viral families, turned out capable of infecting exactly one thing: amoebae.

That is not a coincidence or a discovery about what these viruses are inherently limited to — it’s the result of a rule the researchers built into their methods before they ever opened a sample.

Nine sites, one very old lake bed, and a five-family haul

The study, published in the journal Viruses in February 2023, describes sampling seven ancient Siberian permafrost cores, a Lena River sediment sample, and one modern surface soil sample from Kamchatka as a comparison point. Out of that set, the team isolated 13 new viral strains spanning five clades: pandoraviruses, cedratviruses, megaviruses, pacmanviruses, and a new strain of pithovirus, the family first revived by the same lab back in 2014. Beyond the 48,500-year Pandoravirus yedoma strain, other samples dated to more than 27,000 and 28,600 years old, meaning the youngest viruses in the batch had still been dormant since well before agriculture existed anywhere on the planet.

Getting a virus that old to replicate again sounds harder than it is, mechanically. Permafrost is an unusually good preservative: constant sub-zero temperatures, no light, and low oxygen slow decay to something close to a standstill. The genuine difficulty was deciding what, exactly, the revived particles should be allowed to infect — not reviving them in the first place.

Why the answer was decided in advance

Every one of the 13 viruses was isolated using a single host organism: Acanthamoeba castellanii, a free-living amoeba common in soil and freshwater that happens to be an excellent, and epidemiologically inert, lab culture system for giant viruses. The paper’s own framing makes clear this was the point, not an accident: as the authors put it, the viruses recovered “belong to five different clades infecting Acanthamoeba spp.” precisely because of “the host specificity imposed by our protocol.” In plain terms, the team only exposed each sample to amoeba cultures, so the only viruses that could be detected at all were ones already capable of infecting amoebae. Anything in the sediment that might have targeted a mammal, a bird, or a human cell simply had no host present to reveal itself.

Claverie has been explicit about why that constraint exists. “Our protocol is to put amoeba cultures in the lab in contact with various samples, in the hope that they will contain viruses capable of infecting amoebas,” he told Live Science, adding a flatter, more direct version of the same point: “We will never risk isolating a virus eventually capable of infecting modern mammals.” The paper itself makes the comparison explicit, noting that the biohazard from reviving amoeba-only viruses is “totally negligible” next to the far riskier work of hunting for pathogens directly inside the frozen remains of mammoths and other ancient mammals, which is why that specific line of research is confined to a biosafety level 4 facility in Novosibirsk rather than an ordinary university lab.

Every choice the team made before opening a single sample was a choice about what they were willing to risk being wrong about.

The part that actually worries the researchers

That caution isn’t really about this batch of 13 viruses. It’s about what else permafrost is holding, and how much more of it is on its way to thawing. Claverie has made this argument before: back in late 2022, months before Pandoravirus yedoma’s record-setting age was even published, he told Newsweek, “If amoeba viruses can survive in these conditions, there is no reason for other viruses not to survive as well” — the same underlying logic the yedoma finding would go on to reinforce.

The paper’s own conclusion frames the risk in terms of exposure rather than certainty: nobody can currently estimate how long a thawed ancient virus would stay infectious once it hit open air, or how likely it would be to encounter a suitable host in that window. What has changed, and what makes the question worth asking at all, is the denominator. Arctic permafrost is thawing faster as the region warms, and industrial development, mining, and new settlements are sending more people into exactly the areas where 48,500-year-old ground is being exposed for the first time since before modern humans reached most of the planet. The amoebae were never really the point. They were the deliberately narrow lens the researchers chose so that the first question, can something this old still replicate at all, could be answered without opening a second, much harder question before anyone was ready to.

The post French, Russian, and German researchers thawed sediment from nine sites of Siberian and Kamchatkan permafrost and revived thirteen previously undescribed viruses, the oldest of them from ground beneath a Yakutian lake bed dated to more than 48,500 years, and the reason every one of the thirteen can infect nothing but amoebae is a decision the team made before the first sample went into the dish appeared first on Space Daily.

  •  
❌