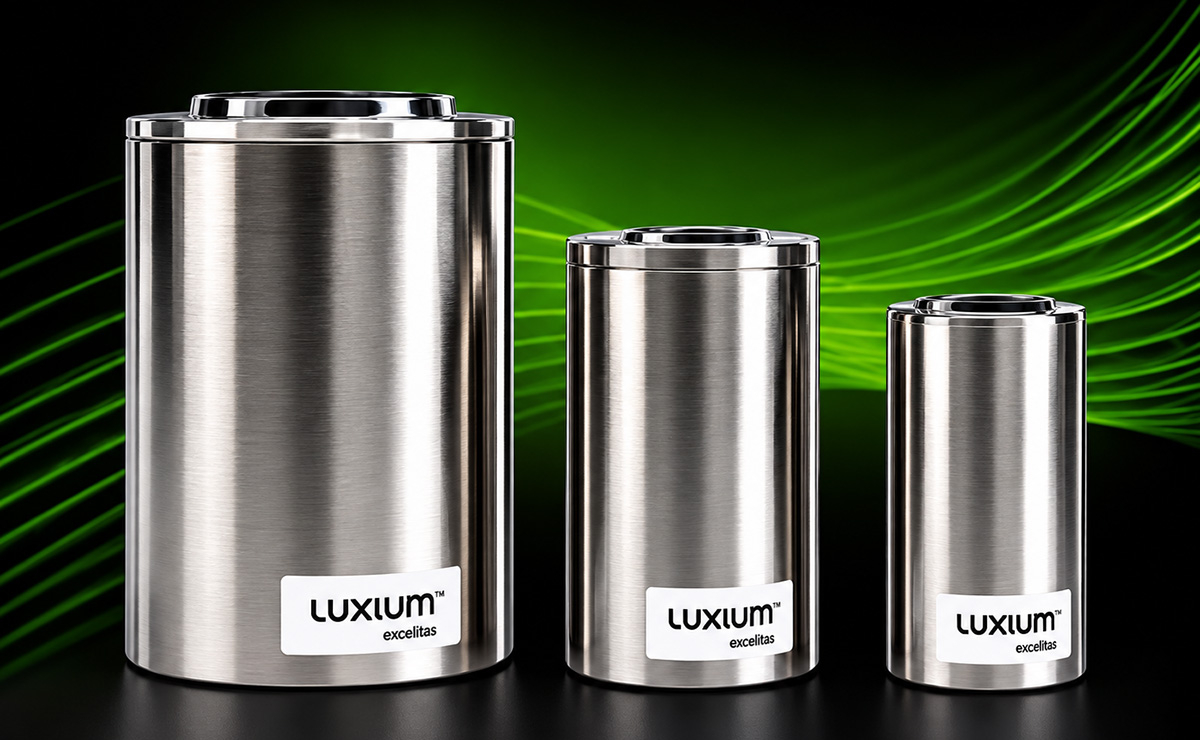
LuxiumTM Lanthanum bromide detectors are available in various sizes.
Scintillation detection advanced rapidly during and after the Second World War, with a major breakthrough coming in 1948 when physicist Robert Hofstadter discovered that thallium-activated sodium iodide (NaI(Tl)) was an exceptionally effective scintillation material for detecting gamma rays. This discovery laid the foundation for practical gamma-ray spectroscopy and established NaI(Tl) as a cornerstone of radiation detection.
The principle behind scintillation detection is relatively simple. When a high-energy gamma-ray photon from a radioactive source enters a scintillator crystal, the gamma ray deposits energy in the crystal, which is converted into scintillation light. This light is directed onto a photoreceptor—such as a photomultiplier tube or a silicon photomultiplier—which converts the optical pulse into an electrical signal. The amplitude of that signal directly corresponds to the energy of the incoming gamma ray, allowing scientists and engineers to build a detailed spectrum of the radioactive source.
Today, there is a wide range of methods for detecting and discerning radioactive sources. One of the most prevalent is NaI(Tl). While versatile and relatively inexpensive, NaI(Tl) has moderate energy resolution, typically around 6–7% at 662 keV for common detector configurations, i.e. just a basic ability to distinguish between different energies of incoming radiation, making precise identification of multiple radioactive species challenging.
The gold standard for energy resolution (<0.2%) is high-purity germanium (HPGe), a semiconductor technology that very clearly separates closely spaced isotope signatures. However, HPGe detectors are more complex and costly, and require cryogenic cooling traditionally using liquid nitrogen or mechanical cryocoolers.
Diane Fruehauf, Business Unit Director (Radiation Detection) at Excelitas Technologies.
“Lanthanum bromide is kind of special,” explains Diane Fruehauf, Business Unit Director (Radiation Detection) at Excelitas Technologies. “It hits the sweet spot where you can have better energy resolution than traditional scintillators, but it’s simple, it’s compact, it’s fast and you can operate at room temperature. You can get a lot of the performance advantages without the cryogenic cooling.”
Beyond a highly respectable energy resolution of ~2.6%, cerium-doped lanthanum bromide (LaBr3(Ce)) also exhibits an exceptional response speed. With a primary decay time of approximately 25 nanoseconds—compared to hundreds or thousands of nanoseconds for other scintillators—its fast response enables high count-rate operation and rapid data collection, making it particularly valuable when measuring intense radioactive sources.
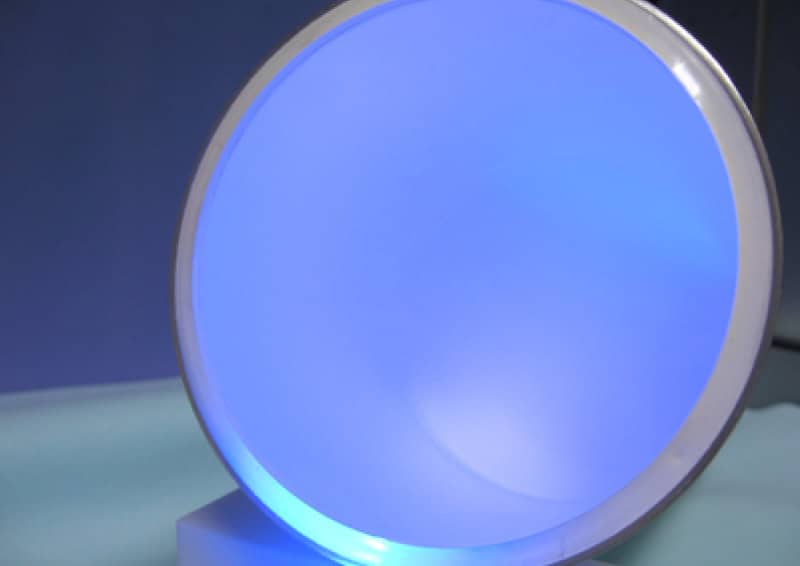
Luxium™ Lanthanum bromide in action
LuxiumTM Lanthanum bromide detector has an energy resolution of ~2.6%.
These properties make LaBr3(Ce) an ideal scintillator for radiation detection in a wide range of situations. One application is border security, explains Guillaume Gautier, Product Manager at Excelitas Technologies. “For example, it enables the signature of nuclear materials to be discriminated and identified from radioisotopes commonly encountered in medical applications, preventing materials of concern from getting masked,” he says. “These emitted gamma-ray photons are close in energy but, unlike other scintillators, lanthanum bromide can discriminate between them accurately.”
Another key use-case is environmental monitoring. After the Fukushima nuclear accident, for example, Luxium™ Lanthanum bromide detectors (made by Excelitas Technologies) have been used to survey the surrounding areas for radioisotopes. And they are used in routine environmental monitoring too, with independent agencies utilizing LaBr3(Ce) detectors to map field contamination, inspect soil or agricultural runoff, and verify environmental safety.
A more complicated application is prompt gamma neutron activation analysis (PGNAA). This works by bombarding a target material with neutrons, causing atomic nuclei to emit characteristic gamma-ray photons almost instantaneously. These photons are then detected and resolved by a high-performance LaBr3(Ce) scintillation crystal.
“It’s used in mining, for example,” says Gautier. “You activate the raw material and you detect the composition, and from this you are able to analyse—in the field—whether it contains anything valuable, such as lithium or rare-earth elements, before you begin extraction.”
Precision manufacturing and the Excelitas advantage
Excelitas Technologies has a longstanding history of innovation with LaBr3(Ce). Originally developed through academic research in Europe in the early 2000s, these crystals showed significant potential for high-performance radiation detection. Saint-Gobain Crystals recognized that potential and pioneered their commercialization, building decades of expertise in the development and manufacture of LaBr3(Ce) detectors. After rebranding to Luxium Solutions for a brief time, the company was acquired this year. Today, that expertise continues as part of Excelitas Technologies.
Nowhere is this expertise more valuable than in growing large, high-purity LaBr3(Ce) single crystals with uniform light yield. This task is made difficult because the crystals are sensitive to ambient moisture and require absolute chemical purity during growth to maintain structural integrity and optical clarity. The solution was to take control of the whole process in-house. “We control our purification and refine our materials ourselves, which gives us a level of process control that directly yields reliable, high-quality crystals,” explains Fruehauf. “Our goal is to deliver consistent performance from crystal to crystal, year after year.”
More recently, the team has focused on pushing lanthanum bromide’s properties even further, developing what they have branded ‘Luxium™ Enhanced Lanthanum bromide’. By co-doping the crystal structure with cerium and strontium, Excelitas engineers improved the scintillation proportionality, yielding higher light output and even sharper resolution.
“With standard Luxium™ Lanthanum bromide, we guarantee energy resolution under 3%,” explains Gautier. “With our enhanced version co-doped with strontium, we lower that threshold below 2.5%, guaranteeing levels down to 2.3% or even 2.2% in optimum conditions.”
And now, the company is not only manufacturing raw crystals for OEMs, but also detector assemblies integrated with photomultiplier tubes or silicon photomultipliers. Backed by Excelitas’ broader photonics and electronics portfolio, the company is well-positioned to deliver complete end-to-end detection solutions for a wide range of demanding field applications.
“At the company, we’re always learning and the technology is always evolving, but ultimately it comes down to helping customers make faster, better decisions in the field,” says Fruehauf. “Whether it’s monitoring environmental safety or identifying critical materials for new technologies, the more efficient and accurate we can help everyone be, the better it is for everyone.”
How can one sample reveal more when examined from multiple perspectives? Combining SEM, TEM/STEM, 4D-STEM, spectroscopy, nanoindentation, nanoCT, CryoSEM or other analytical techniques can provide complementary information. Bringing these approaches together places demand on sample positioning, access and manipulation.
This webinar explores the role of precision sample manipulation as a key element for multimodal nanoscale characterization. We will look at how flexible, multi-axis positioning can support sample alignment, different measurement geometries and transitions between imaging, spectroscopy, diffraction, probing and other analytical methods.
Using SmarAct’s customizable SEM platform and related positioning solutions as examples, we will discuss practical approaches to integrating precise sample motion into advanced microscopy and characterization workflows, including applications in SEM, STEM, TEM, spectroscopy, tomography and in-situ experimentation.
The focus is not on one technique, but on the sample manipulation. How precise, adaptable manipulation systems can help to investigate the same specimen across complementary measurements and extract a more complete picture of its structure and properties.
Alexandra Gluck
Alexandra Glück is a physicist turned technical sales engineer. She studied in Freiburg and Berlin and has worked at German Aerospace Center (DLR), where she completed her doctorate in experimental physics. At SmarAct, she is in contact with researchers and companies active in materials science and related fields, and enjoys having technical discussions about the developments at the frontier of science and technology.
Physicists have experimentally reconstructed the quantum probability distribution of an exciton for the first time using super-fast spectroscopy. By simultaneously capturing the spatial and momentum spreads of these short-lived quasiparticles, the work adds to our understanding of how excitons evolve in complex materials. According to members of the research team, this improved understanding could lead to advances in organic photovoltaic devices.
When light shines on materials such as insulators and semiconductors, the energy from these incident photons can sometimes promote electrons in the material to higher energy bands, leaving behind positively charged holes. The electron and hole can then bind together, forming a neutral excited quasiparticle known as an exciton.
Excitons play a key role in light harvesting in optoelectronics devices, but their quantum mechanical structure has proved notoriously difficult to study. Among other reasons, this is because the excited electrons decay back to their original states within just picoseconds (10-12 s), and standard spectroscopic techniques are not fast enough to simultaneously probe the spatial dimensions of the quasiparticles’ orbits and their momentum profiles within that time limit.
Photoemission orbital tomography
In the new work, physicists led by Peter Puschnig of the University of Graz, Austria, together with colleagues at Marburg University and Forschungszentrum Jülich in Germany, got around this problem thanks to a technique called time-resolved photoemission orbital tomography (trPOT). This technique combines pump-probe photoemission spectroscopy with momentum microscopy and offers resolution at the femtosecond (fs, 10-15 s) scale, making it well-suited to capturing the exciton wavefunction.
Puschnig and colleagues began by applying an ultrashort normal-incidence laser pulse with an energy of 2.35 eV to an organic semiconductor called alpha-sexithiophene, which is employed in optoelectronic applications such as solar cells. This pulse generated the excitons. The next step was to eject the electrons from these excitons using a second, linearly polarized laser pulse with a relatively high energy of 21.7 eV. This process is known as photoemission.
“If we then measure the energy and direction of the ejected electrons, theoretical models allow us to infer their quantum-mechanical state,” Puschnig explains. “And by varying the time between the first and second laser pulses, we are able to obtain snapshots of the exciton at different times after its creation.”
The team found that the exciton in the sexithiophene films initially extends over a distance of approximately 1.5 nm, or roughly three molecules. Within 400 fs of its creation, though, its size contracts by about 25%. “What makes this particularly exciting is that we are not just measuring an energy or lifetime but are also gaining access to the quantum-mechanical wave function of the exciton itself, including its spatial structure and phase,” Puschnig says.
Coordinating demanding experiments and theory
Puschnig says the idea for the experiment grew out of the team’s earlier work on photoemission orbital tomography (POT), including a 2021 proof-of-principle study showing that it could be extended into the ultrafast regime. “The main challenge was coordinating demanding experiments and theory: producing well-defined molecular films; transporting them under ultra-high vacuum from Jülich to Marburg in a vacuum suitcase; performing ultrafast photoemission measurements; and carrying out computationally intensive ab-initio calculations in Graz to interpret the data,” he adds.
The work, which is detailed in Physical Review X, provides a new way to study excitons directly in real space and follow their quantum-mechanical evolution in time. According to the researchers, it could help us understand how excited states evolve into charge-separated states in the donor/acceptor systems that occur in organic photovoltaics, where the electron and hole can begin to separate after photoexcitation.
The researchers say their next goal is to move from the relatively simple exciton they studied to more complex systems. “We want to observe how charge-separation processes are controlled by the molecular and electronic structure of a material,” Puschnig tells Physics World. “Doing this will be particularly interesting because charge separation is the crucial step between absorbing a photon and generating a usable electrical current in an organic solar cell.”
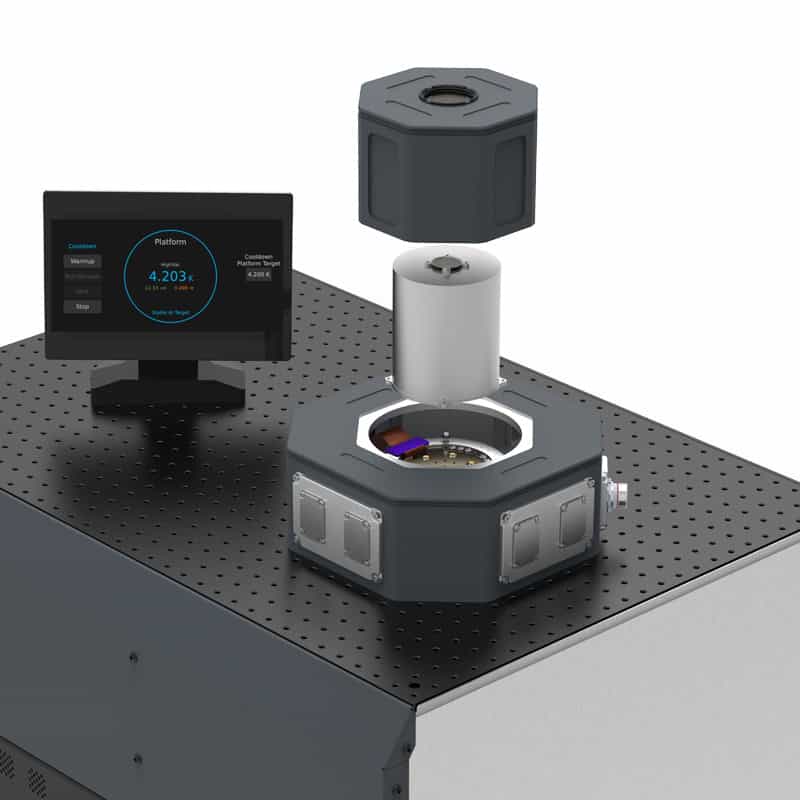
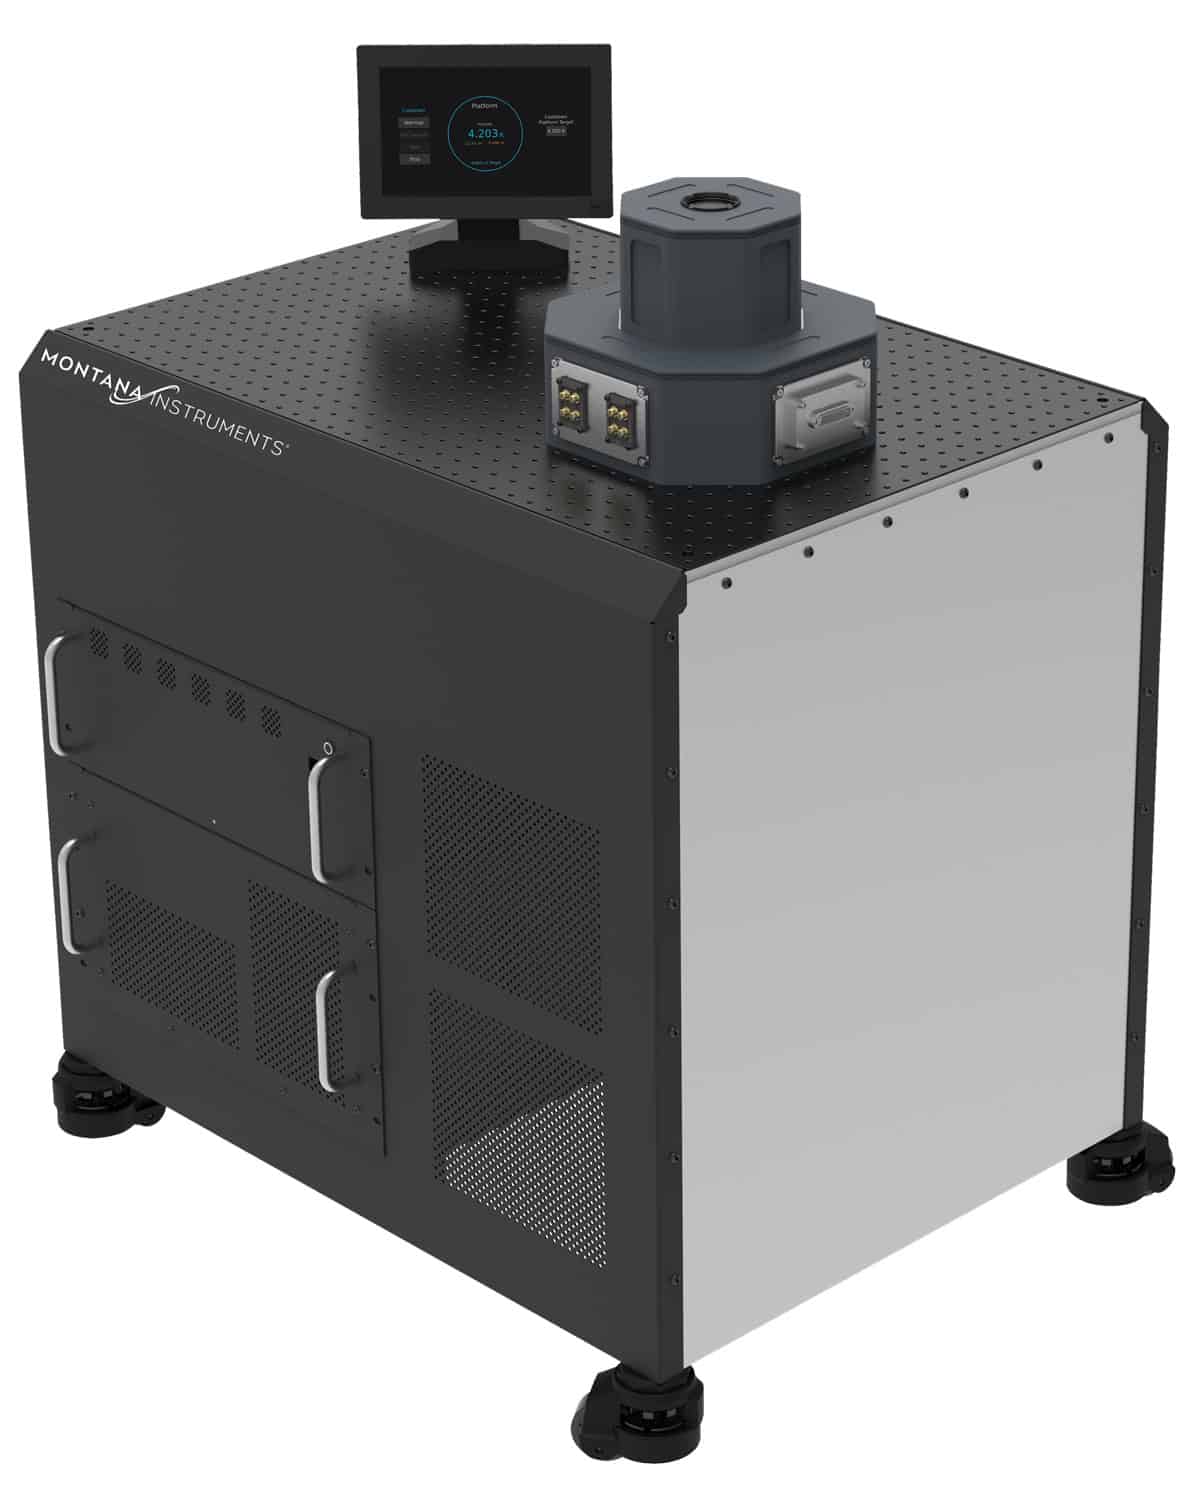
Cool stuff The new RapidCycle 100 EC cryostat from Montana Instruments, which can cool down from room temperature to 4 K within an hour and warm back up again just as fast. (Courtesy: Montana Instruments)
As quantum computing enters its commercial phase, demand is growing for electronic components that can operate reliably at ultralow temperatures. But suppliers that routinely test the performance of their devices under a wide range of conditions rarely extend their characterization efforts to the cryogenic regime. Quantum developers must either test the components themselves, or run the risk that a faulty device ruins the performance of increasingly complex quantum machines.
“Quantum computers are often operated within a dilution refrigerator, which takes days or weeks to cool down,” says Ben Wilbur, a senior design engineer at cryogenics specialist Montana Instruments. “A single faulty component requires the whole system to be warmed up again, which can waste the best part of a month and slow down progress.”
To avoid that scenario Montana Instruments has designed and built a cryostat, called the RapidCycle 100 EC, that can cool down from room temperature to 4 K within an hour and warm back up again just as quickly. The overall cycle time is around three times faster than for similar systems, and a fraction of the time needed to cool down and warm up a large-scale dilution fridge.
Such a rapid cycle time offers an efficient solution for quantum engineers to validate electronic components before integration and for suppliers to measure the low-temperature response of their devices before shipping them out to customers. “From talking to different companies we know there is a market desire to test more components, but there is also a commercial impetus to streamline the testing process,” says product manager Patrick Gale.
Gale points out that many of the electronic components that are being used to build quantum computers have not been designed to operate at ultralow temperatures. As an example, radio-frequency devices play a critical role in many qubit architectures for controlling and reading out the quantum states, but manufacturers of these components are unlikely to have the expertise or equipment to know whether their components function effectively in this regime.
“This system is designed for companies that want to understand how their devices perform at ultralow temperatures, but without needing to hire a cryogenics engineer,” says Gale. “Having the capability to characterize their own components could offer suppliers a competitive advantage, allowing them to pre-qualify their devices and even to improve their low-temperature performance for quantum applications.”
Commercial drivers
The idea for the RapidCycle cryostat first emerged in 2023. Initial development results were promising, but more immediate priorities delayed efforts to engineer a commercially viable product. Around a year ago, as the need for faster cycle times became more urgent within the rapidly expanding quantum industry, the company restarted its design work. “We felt we were in a unique position to tackle this problem,” says Gale.
Speedy response Montana Instruments’ fast-acting cryostat lets quantum engineers validate electronic components and measure the low-temperature response of devices before being shipped to customers. (Courtesy: Montana Instruments)
But cutting the cycle time by a third was not an easy task. “Most of the thermal energy is from room temperature down to around 50–70 K, so that is where we needed to focus our development efforts,” says Wilbur. “Beyond that the temperature starts to drop much more rapidly, since the heat capacity of the materials become much lower close to absolute zero.”
While the original work had shown that rapid cool downs were feasible, further iterations were needed to achieve the target temperature of 4 K and to generate enough cooling power to maintain the device at that temperature during the test. “To optimize the performance we needed to think carefully about the materials we used, and about the amount of thermal mass that really needed to be in the system,” says Wilbur. “The more you have in there, the longer it will take to cool down.”
While there was a clear design focus to minimize the thermal mass, the system has been engineered to provide plenty of space and flexibility for testing electrical components. Samples can be mounted on a 100 mm platform, large enough to accommodate a diverse range of electronic components, while the configuration can easily be adapted to different testing protocols. Extra space has also been created around the sample to provide an easy-access wiring system that supports a flexible combination of RF and DC feedthroughs into the cryogenic environment.
“As these tests get more complicated, all the inputs and outputs to the sample can make the cryostat really messy,” says Wilbur. He explains that the unit has a tiered structure, with the sample space at the top and a lower housing that provides extra room for connecting and disconnecting the cables. “It really cleans up the wire management but also reduces the volume within the sample space to achieve a fast cycle time.”
Targeted design
Other design features have focused on the usability of the system, particularly for electronic engineers and technicians with limited knowledge of cryogenics. In keeping with the company ethos of making cold science simple, the complexities of the cool-down process – such as reaching the right vacuum level before engaging the cryocooler – are hidden from view. “The user just needs to set a target temperature and press the cool-down button,” says Gale. “The same for warm-up, all the temperature monitoring is done automatically so the user can just walk away.”
A touchscreen interface provides real-time readouts of the internal temperature, vacuum pressure and temperature stability, while the system can also be connected to a computer network to allow for remote control and monitoring. All the measurements taken with the system can easily be exported over the network connection, enabling them to be combined with other performance data that have been collected for device characterization.
Such automated processes are nothing new for Montana Instruments, which has built a reputation for building systems that allow users to focus on their own experiments and assemblies rather than the intricacies of the cryogenics. In this case, however, special attention was also paid to creating an integrated system that can operate within the constraints of a manufacturing environment. “We focused on consolidating the form factor to ensure that the unit doesn’t take up too much space on the production floor,” says Wilbur. “The cryostation and all the controls fit into a cart that can easily be wheeled around.”
Following the official launch of the RapidCycle earlier this year, Montana Instruments is expecting to ship the first commercial units in the next month or two. But Gale points out that some beta customers in the manufacturing sector have already been trialling the system. “The feedback has been positive,” he says. “With some simple training we have had them up and running in a day or two, and they really appreciate the fast cooldown.”
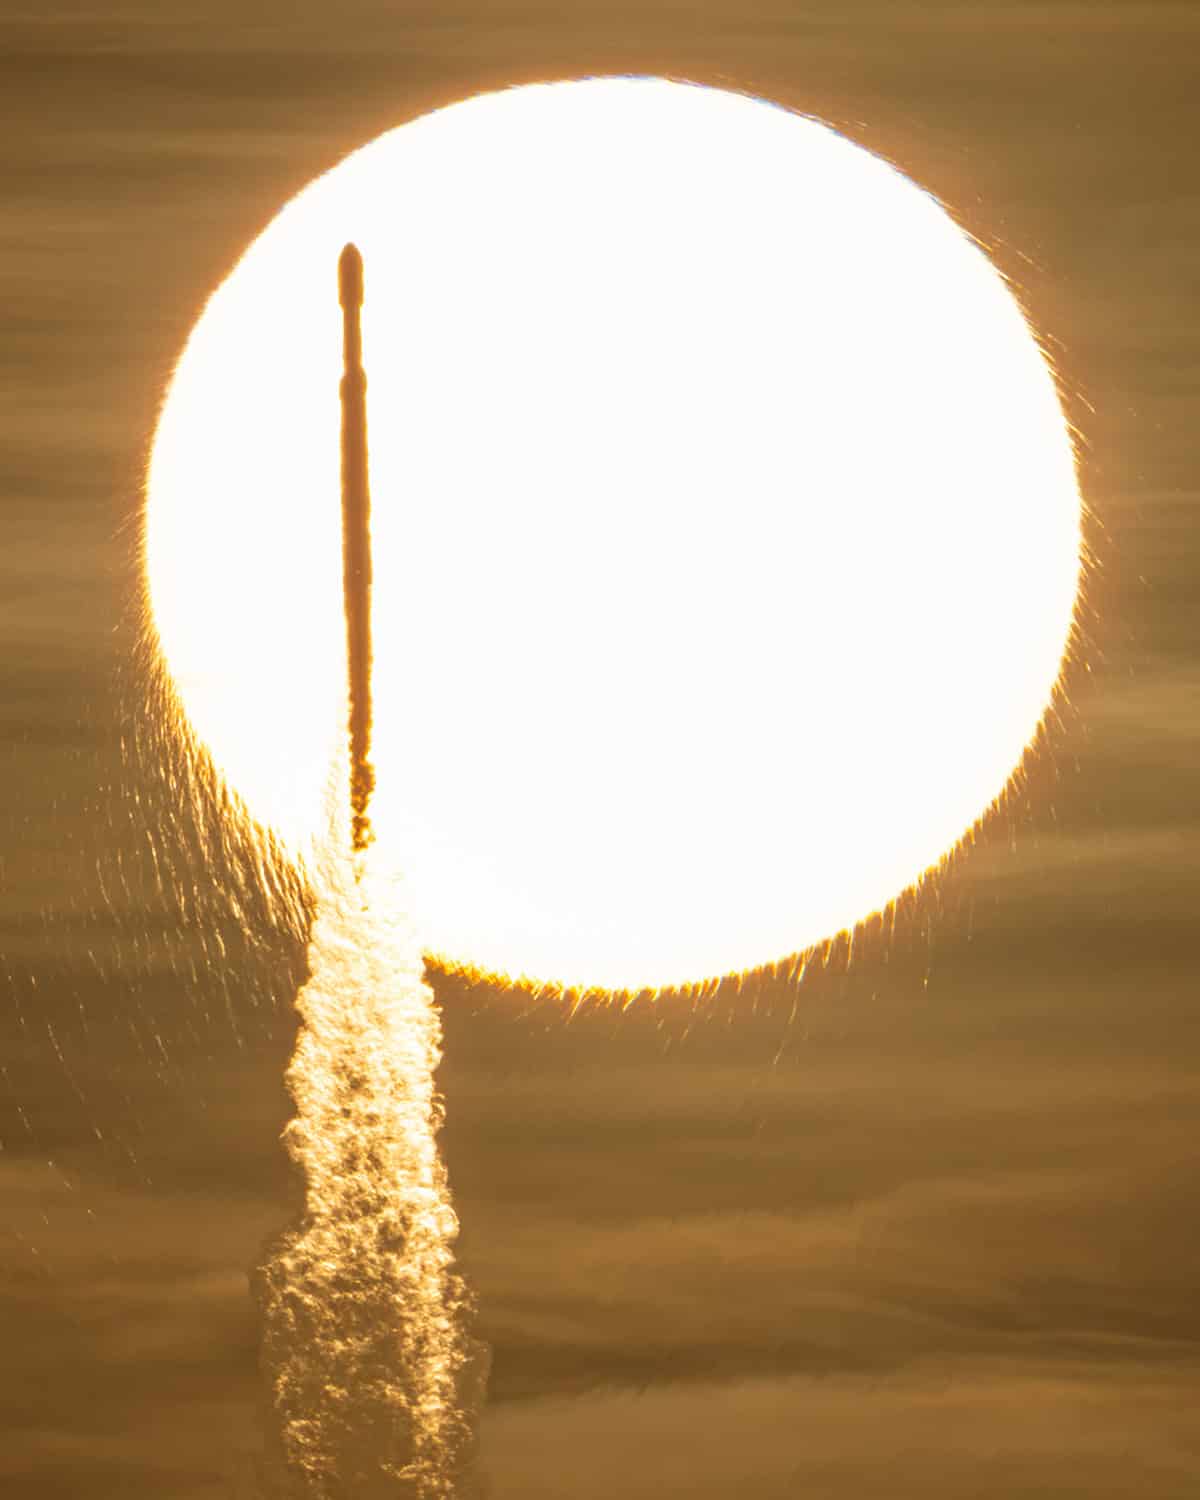
Lift off A SpaceX Falcon Heavy rocket with NASA’s Nancy Grace Roman Space Telescope on board is seen transiting the Sun during launch from the Kennedy Space Center in Florida on 30 August 2026. Named after the agency’s first chief astronomer, the telescope will survey billions of stars and galaxies with a field of view far larger than Hubble’s, helping scientists to study dark energy, exoplanets and the evolution of the universe. (Courtesy: NASA/John Kraus)
At 7.26 a.m. on Sunday 30 August 2026, a SpaceX Falcon Heavy rocket rose from the Kennedy Space Center in Florida, carrying NASA’s Nancy Grace Roman Space Telescope on its initial three-month journey beyond the Moon. As I watched online from my home in Sydney, Australia, that evening, the launch did not disappoint. There was all the familiar theatre of a rocket taking off: the brilliant column of flame, mission control calling out that it had gone through the point of peak aerodynamic stress, then the booster and main-engine cut-offs, before the fairing finally fell away.
Just 31 minutes after lift-off, Roman separated from its carrier rocket and began its long journey to L2, the second Sun–Earth Lagrange point, 1.5 million kilometres from Earth. Once it arrives there at the end of November, the gravitational balance will let Roman maintain its orbit with relatively little fuel. The Sun, Earth and Moon will all be on the same side of the spacecraft so that a single shield can block their light and heat, while the telescope faces away from them and stays cold.
Yet the most impactful part of Roman’s journey will be less visible. When its first images are released, hopefully in early 2027, the telescope will accelerate a change already long under way in astronomy. Rather than investigating carefully selected objects in the sky, astronomers are now increasingly mapping entire populations – monitoring a changing sky and searching enormous datasets for discoveries no single observer could conceivably find by eye. Roman will speed up that trend much further.
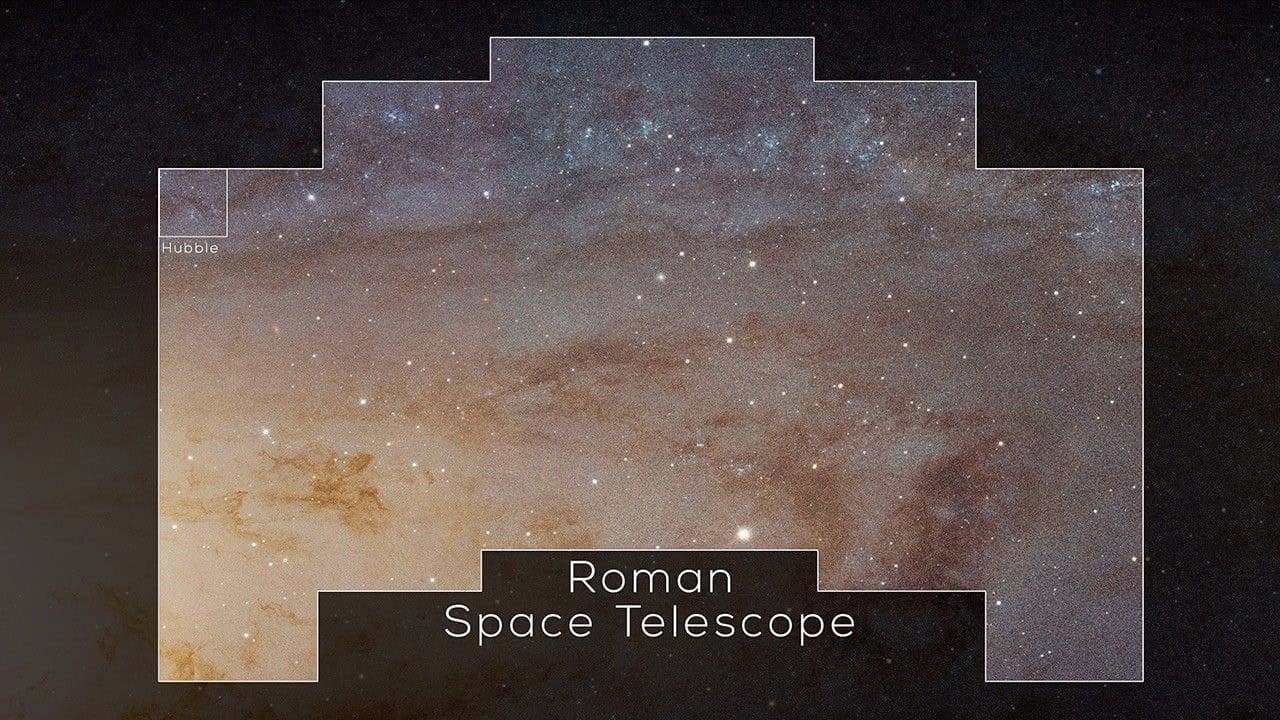
During the launch broadcast, I heard NASA administrator Jared Isaacman say Roman will study the “ecology of the universe”. Some cameras, he suggested, can provide an overview of a forest, while others can zoom in on individual birds and leaves. Roman, however, will combine both approaches. With a 2.4 m-diameter primary mirror, its images will be as sharp as those from the Hubble Space Telescope. But Roman’s Wide Field Instrument (WFI) can cover at least 100 times as much sky in a single pointing.
Bigger, brighter, better The Roman telescope will scan a much wider field of view than the Hubble Space Telescope (insert) ever could. (Courtesy: NASA)
With Roman, the detailed and population views become part of the same observation. Traditionally in astronomy, a sharp image of a single galaxy can reveal its stars, dust and morphology, while a wide but (usually) less detailed survey can tell us how galaxies are distributed. Roman will do both: it will record fine detail while retaining the wider view of the environments and populations to which individual objects belong. It will, in essence, allow astronomers to study in detail entire cosmic ecosystems as well as their constituent objects.
And that is what makes Roman so revolutionary.
From observing targets to interrogating surveys
For much of modern professional astronomy, observing began with a proposal to study an object of scientific interest. If it was accepted by an observatory’s time-allocation committee, the astronomer would travel to the telescope (or, later, log in remotely), collect a manageable quantity of data, reduce and analyse it, and retain exclusive access during a proprietary period while preparing their first research paper. The observer knew why each exposure had been taken.
That model has not disappeared. The Hubble and James Webb space telescopes remain extraordinarily powerful precisely because they can study selected targets in fantastic detail. Roman’s coronagraph, meanwhile, will test active optics that suppress starlight far more effectively than existing space-based coronagraphs, allowing it to image giant planets orbiting nearby stars and paving the way for future missions to photograph smaller, Earth-like worlds.
However, alongside targeted astronomy, a different observing mode has become increasingly important, namely observatories designed to produce systematic, reusable maps of the sky. The Gaia mission of the European Space Agency (ESA) is one such example. Over its 11-year life between 2014 and 2025, Gaia took more than three trillion (3 × 10¹²) observations of roughly two billion stars and other objects. Its public catalogues have allowed researchers to reconstruct the Milky Way’s structure, identify stellar streams and star clusters, examine binary stars and search for rare objects, often without ever applying for new telescope time.
Gaia’s third data release, which was made public in June 2022, included 10.5 million “variable sources” – any objects that change in brightness over time, sometimes regularly and sometimes unpredictably. They were all classified using supervised machine-learning techniques, in which an algorithm learns from previously labelled examples. No astronomer could personally have inspected that many light curves (records of brightness versus time).
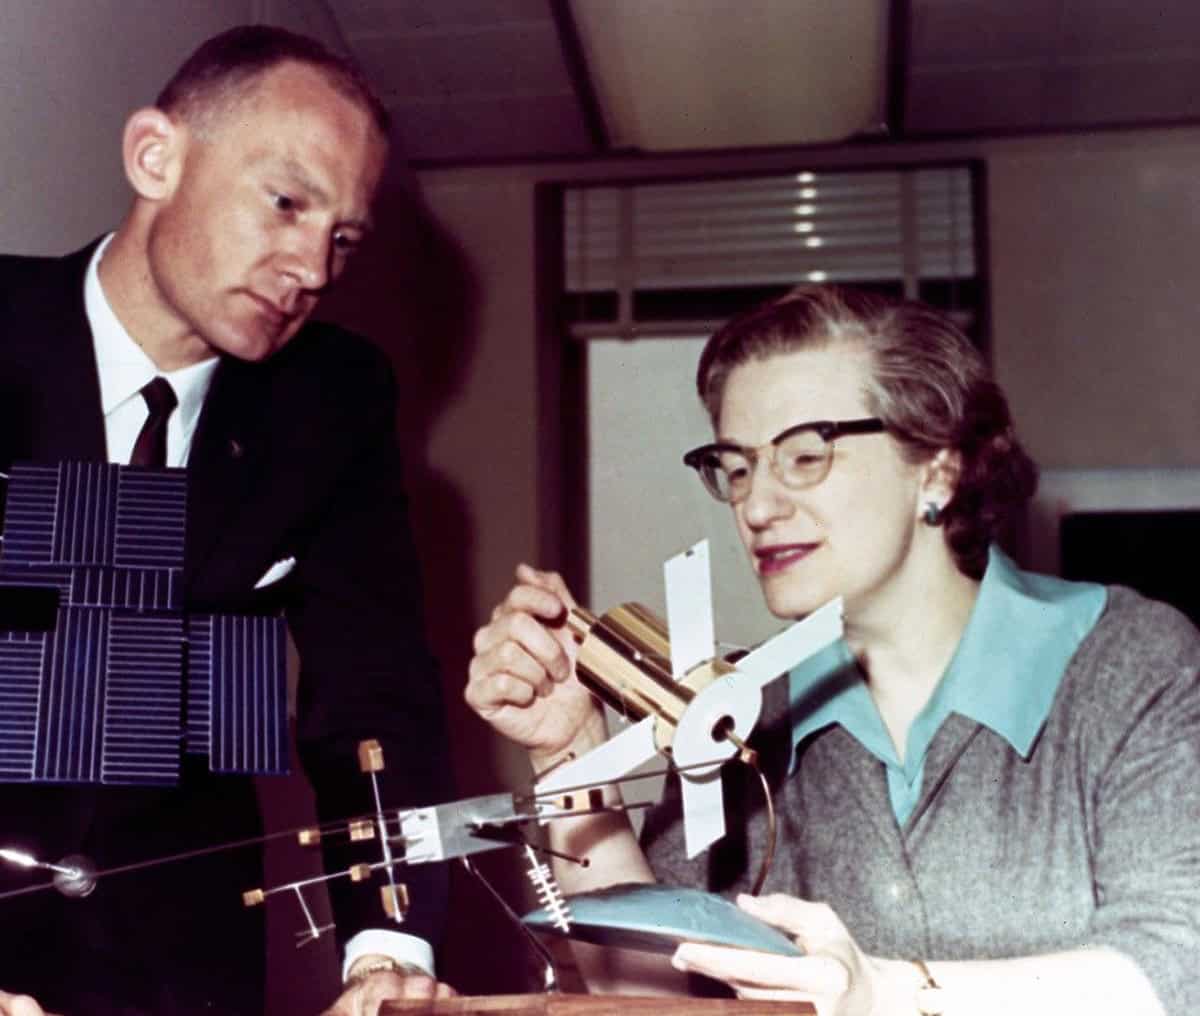
Space pioneer Nancy Grace Roman, born in 1925, was the first female executive at NASA and served as the agency’s first chief of astronomy throughout the 1960s and 1970s. She created NASA’s space astronomy programme and is known to many as the “Mother of Hubble” for her role in planning the Hubble Space Telescope. Pictured here explaining the Advanced Orbiting Solar Observatory to astronaut Edwin “Buzz” Aldrin, she was also an active public speaker, educator and advocate for women in science. (Courtesy: NASA)
The Vera C Rubin Observatory in Chile makes the new approach to professional astronomy even more explicit. Its decade-long Legacy Survey of Space and Time, which began in 2026, is collecting some 10 terabytes of data each and every night. Whenever its software detects that something has changed, it issues an alert. When alerts are triggered, they will be sent to automated “brokers”, which will cross-match them against existing catalogues, classify them and rank candidates for follow-up scrutiny. It is unlikely that an astronomer searching for supernovae, variable stars or hazardous asteroids, for example, will begin with the telescope’s raw images. Throughout modern astronomy, the starting point will instead be a filtered stream produced by a chain of algorithms.
Roman will carry this survey logic into space, beyond the blurring and infrared glow of the Earth’s atmosphere. As Roman’s deputy WFI scientist Ami Choi explained during the launch broadcast, the wide view is essential, especially for cosmologists. They don’t only need sharp measurements of individual galaxy shapes but also data on enough galaxies across a sufficiently large volume. That way they can distinguish the behaviour of the universe on large scales from the peculiarities of one small region.
Roman's three surveys
Roman’s three core surveys will show how a dataset can be designed to answer one question while creating the raw material for many others.
The High-Latitude Wide-Area Survey will map more than 5000 square degrees, which is more than 12% of the sky. It will do this using both imaging and “slitless” spectroscopy, in which spectra are recorded for every suitable object in the field rather than just individually selected targets.
Measuring the subtly distorted shapes of hundreds of millions of galaxies should reveal the distribution of dark matter – the mysterious, invisible stuff that makes up 27% of the universe by mass-energy – and also how cosmic structure has grown over time. Yet the same observations will also contain stars in the Milky Way, nearby galaxies, distant quasars, strong gravitational lenses and objects that no survey committee will ever have thought to put on a target list.
Roman’s High-Latitude Time-Domain Survey, meanwhile will repeatedly image “deep” fields at roughly five-day intervals, producing an anticipated 100,000 transient light curves. Type Ia supernovae, whose luminosities can be standardized to make them cosmic distance indicators, will trace the expansion history of the universe, but the repeated images should also expose variable galactic nuclei and rare explosions.
Finally, the Galactic Bulge Time-Domain Survey will revisit six fields of the sky about every 12 minutes during its most intensive observing seasons. Its main goal is to detect the temporary brightening of a star that occurs when the gravity of an unseen object passes in front and bends its light. Such “gravitational microlensing” events can reveal cold planets orbiting their host stars as well as free-floating planets and isolated black holes. The same sequence becomes a record of stellar variability and motion.
The reuse of data that we’ll see with Roman is not entirely new. Photographs recorded on physical glass plates often preserved far more sky than the astronomer who exposed them intended to study. Indeed, there have been instances of researchers trawling through old plate archives who’ve made discoveries decades after the photos were originally recorded. Electronic detectors, which produce digital images, made searching old data in this way far easier.
But what is new is the scale and the degree to which reuse is built into the Roman observatory from the outset. Many papers about data from the Roman mission will, I am sure, be written years later by researchers who were never involved in choosing the original data collection and may encounter the observation only as a row in a database.
Together, these observatories mark the arrival of what might be called astronomy’s “production era”. The phrase may sound industrial, but it describes a real shift in our professional practice. Telescope time remains precious, but it is no longer the only scarce resource. What will be increasingly hard to come by will be the capacity to process, connect and interpret what surveys have already observed, and to formulate a question sharp enough to extract meaning from an archive built for many purposes.
A picture too large to see
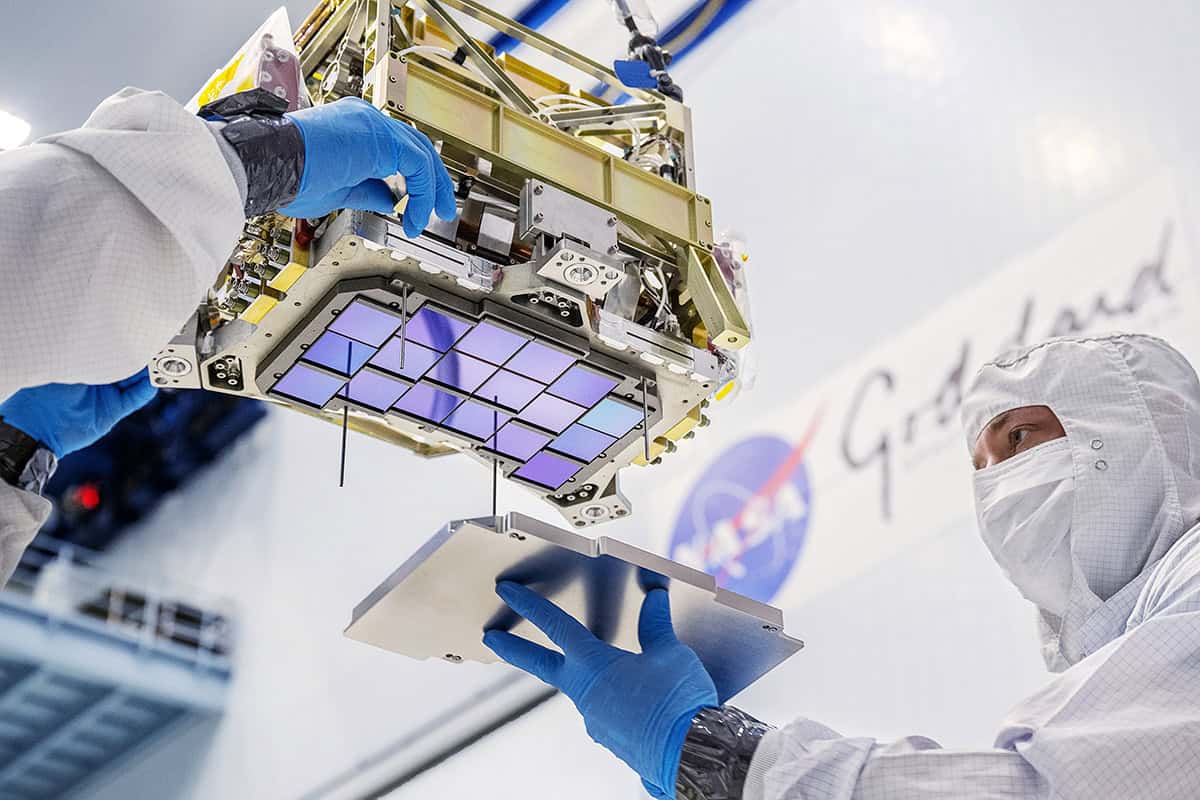
The data that Roman will yield is mind-boggling. Roman’s WFI has 18 infrared detector arrays with a total of about 300 million pixels. Even one field would require three dozen 4K television screens to display at full resolution. But Roman will tile thousands of such fields into surveys. During the pre-launch broadcast, Roman programme scientist Dominic Benford joked that NASA would need more than 500,000 TV sets to display the largest completed survey; laid out together, they’d cover some 45 city blocks.
Instrumental magic The Roman telescope’s Wide Field Imager has 18 detectors that can create 300-million-pixel images over a 0.28 square degree field of view. (Courtesy: NASA/Goddard Space Flight Center)
Calling this a single “picture” is convenient but misleading. It will be a computationally constructed portrait assembled from many pointings, observing epochs and filters. The telescope collects photons; processing pipelines calibrate the detectors, remove instrumental signatures, align exposures and turn them into images, mosaics and catalogues. In survey astronomy, computation is not something that happens after the observation; it is part of observing.
During its lifetime, Roman is expected to return around 1.4 terabytes (1.4 × 1012 bytes) of compressed data each and every day. In fact, if you take into account the intermediate data generated when the information is processed, Roman’s archive could top 20 petabytes (20 × 1015 bytes) over its five-year primary mission. NASA expects automated methods, including machine learning, to help explore the torrent of data.
Automation is unavoidable, but it poses a subtle problem. Algorithms are excellent at finding examples of phenomena on which they have been trained. The discoveries that change science, however, often do not fit into established categories. An anomaly-detection system can flag statistical outliers, but deciding which outliers are artefacts, familiar objects in unusual circumstances or genuinely new phenomena remains a scientific assessment.
Human involvement in Roman won’t be entirely superfluous, however, and will still be required to make breakthroughs. Citizen scientists will play their part too. We need to encourage amateur sleuths to follow in the footsteps of people like Hanny van Arkel – the Dutch schoolteacher who in 2007 spotted an unfamiliar green cloud in data gathered by the Sloan Digital Sky Survey. “Hanny’s Voorwerp”, as it became known, is an ionized cloud preserving the light echo of a quasar that had faded dramatically.
Open data, uneven opportunity
Roman will need both kinds of intelligence: machines capable of surveying the statistical forest and people – whether professional astronomers or citizen scientists – willing to pause over a strange bird in one of its trees. But the question is not just how Roman’s data will be searched. It is also who will get to search them.
The Roman space telescope will fundamentally change who gets the first chance to make a discovery
Roman, you see, will fundamentally change who gets the first chance to make a discovery. Hubble observers can receive up to a year of exclusive, “proprietary” access to their new data, which is typical for space- and ground-based professional programmes. Roman, however, will have no such period. Calibrated exposures are intended to become public within days, with more elaborate mosaics and catalogues following in periodic releases.
In principle, therefore, anyone will be able to start looking at observational data as soon as it’s released. The beauty of Roman is that a PhD student, a researcher at a small institution, or members of large international consortium will all be able to get going at the same time. The move to “open data” will also benefit astronomers at institutions who have traditionally lacked access to major telescopes.
However, it also complicates familiar ideas about ownership and priority. Who receives credit when one team designs a survey, another builds the pipeline, a machine identifies a puzzling candidate, and a third group recognizes its significance? Will researchers feel pressure to publish quickly rather than investigate carefully when competitors can access the same data?
Indeed, open access does not automatically create equal opportunity. A 20-petabyte archive cannot simply be downloaded onto a laptop. Researchers need computing resources, efficient code and the expertise to use them. That’s why the Space Telescope Science Institute in Baltimore, Maryland, has developed the cloud-based Roman Research Nexus, which will let users analyse mission data where they are stored.
Rather than trying to transfer vast wodges of raw data to their home institutions, researchers will instead write or upload code to a cloud-based environment where the Roman archive is stored, run the analysis there and then download the results. Essentially, they will take their code to the data, not the data to the code. Without such a platform, nominal access to the archive would be of limited use.
Even so, differences in funding, training, network bandwidth and available time will continue to shape who can exploit the archive most effectively. Astronomers will, in other words, still need to understand telescopes, detectors, calibration and astrophysics. But they will increasingly work alongside software engineers and statisticians, evaluate machine-generated classifications and design searches that can operate across billions of sources. Knowing what not to trust in a catalogue may become as important as knowing where to point a telescope.
From 3596 pixels to 300 million pixels
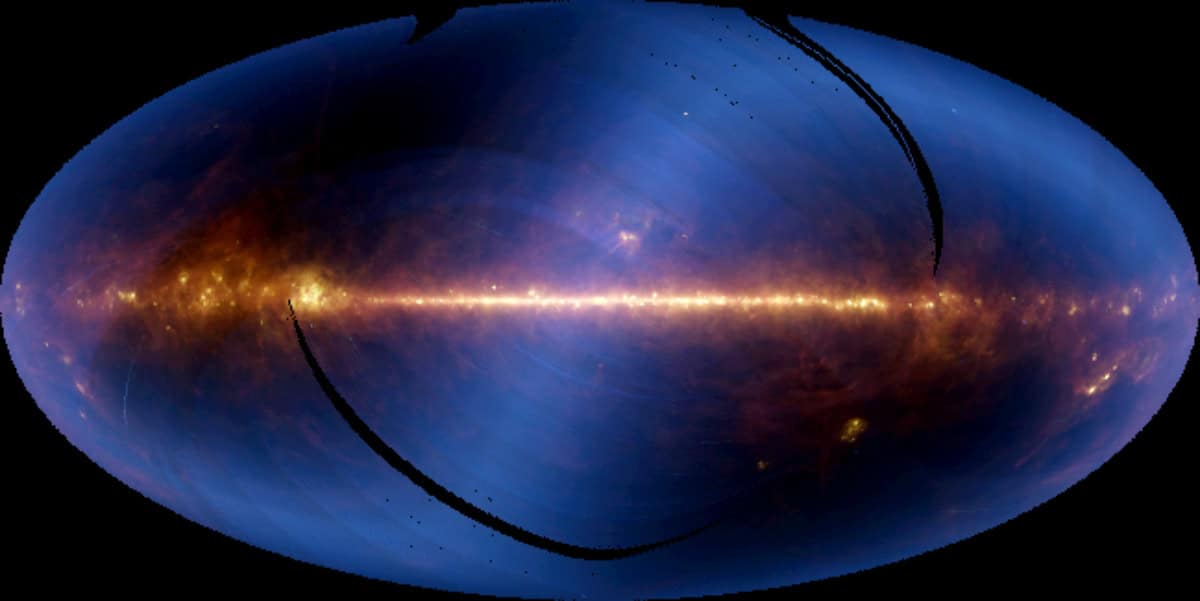
New development The Roman telescope is the next big thing in space-based infrared astronomy, which began in 1983 when NASA launched the Infrared Astronomical Satellite (IRAS). It created images such as this, in which the bright horizontal band is the plane of our Milky Way galaxy, with the centre of the galaxy located in the middle. Being so near, the Milky Way dominates our view of the entire sky, but when IRAS data was processed to show smaller regions of the sky, thousands of sources beyond our galaxy were revealed. (Courtesy: NASA/JPL)
In the early days of optical astronomy, researchers used traditional photographic plates to record individual images of the sky. To look at infrared light, astronomers turned to heat-sensitive detectors, but they’d still have to measure one position at a time, scanning a telescope across a source to build up information sequentially.
That logic changed in 1983 when NASA launched the Infrared Astronomical Satellite, which was the first space-based infrared observatory and had 62 separate detectors. By the 1990s, huge 256 × 256 arrays, encompassing 65,536 detector elements, had become common enough to support detailed infrared imaging of galaxies. Hubble’s Near Infrared Camera and Multi-Object Spectrometer, installed in 1997, used three arrays of this format.
I’ve seen the changes at first hand myself. In 1994 when I was doing my PhD at the University of Groningen in the Netherlands, I published my first paper on near-infrared astronomy, which I’d co-written with an undergraduate student I was supervising. It was based on infrared images of a galaxy taken with a camera on the 2.1 metre telescope at the Kitt Peak National Observatory in Arizona, which used an indium-antimonide detector with just 3596 pixels.
For my PhD itself, however, I observed a sample of galaxies using the European Southern Observatory’s 2.2-metre telescope at La Silla in Chile using a mercury cadmium telluride detector with 65,536 pixels. That was an 18-fold increase over the Kitt Peak camera, yet Roman’s focal plane, with its 18 detector arrays, contains more than 300 million physical pixels.
Progress is not just about pixel count. The advantages of working in space are even bigger because you get none of the atmospheric turbulence or infrared background that you do on Earth. However, it’s not all plain sailing. Space-borne infrared arrays need to be sensitive, uniform, low-noise and reliable; they also have to operate at cryogenic temperatures (roughly 90 K) and endure a harsh radiation environment.
In fact, Roman’s equipment represents decades of progress in materials science, fabrication, electronics, calibration and computing as well as our ability to make pixels ever-smaller. Its infrared detectors are cooled passively by radiators that discharge heat into space rather than by liquid helium.
Larger arrays have also changed what it means to select an astronomical target. A single detector requires an astronomer to decide where to measure: a small array records one selected view. Roman, however, will capture a panoramic field large enough to contain a huge amount of scientifically useful objects. It will transform astronomy, which will be less about choosing what to study and more about working out how to analyse huge data sets.
Looking differently
Roman will not replace targeted observatories or the astronomer’s intuition. Its most intriguing discoveries will often require the James Webb Space Telescope, Hubble or ground-based telescopes to inspect individual objects in greater detail. Instead, these facilities are complementary: one maps entire populations, another inspects exceptional objects, and each changes what the other knows to look for.
Roman’s launch on 30 August lasted little more than half an hour. But the transition the observatory represents has taken decades, driven by larger detectors, faster electronics, public archives and increasingly sophisticated software. I entered professional astronomy when infrared images containing tens of thousands of pixels were normal (see box). Roman will create survey portraits containing trillions of pixels, release its data rapidly to the world and ask humans and machines to explore them together.
When Roman reaches L2 and begins returning science data, its most important legacy may be a way of observing in which the sky becomes a shared, continuously growing dataset. And discovery begins with learning how to explore it.

 Login