❌

Normal view

Galaxies tangled in science and spirit | Space photo of the day for Sept. 7, 2026

7 September 2026 at 15:00

A dark scene with glowing dots on top of it. In the center, there are two wispy galaxies that look tangled in one another.

Nā 'Uhane Māhoe Huki Pū i ke Ola is the Hawaiian name given to this image of NGC 7253 — a pair of spiral galaxies caught in each other's gravity. This image was captured by the Gemini North telescope on Maunakea. (Image credit: International Gemini Observatory/NOIRLab/NSF/AURA)

It is nearly impossible to fathom the entirety of a single galaxy — these realms can span hundreds of thousands of light-years, and sometimes are even millions of light-years across. So imagine the grandeur of now one but two galaxies tangled together, in the process of merging into one. That's what you're seeing in today's featured image.

What is it?

The merging galaxies shown above were discovered by a group of students using the Gemini North Telescope, located on the Maunakea volcano in Hawaii — a very popular and often controversial location for ground-based telescopes. The students hailed from two local institutions, Waiākea High School and the Volcano School of Arts and Sciences, and had access to the telescope with the Project Hōkūlani internship.

They named their discovery Nā 'Uhane Māhoe Huki Pū i ke Ola, which translates to "The Twin Spirits Pulling Together Creating Life."

"'Uhane (spirit) was an important theme for our group. Our experiences throughout the week — 'oli (stargazing), visiting the summit and learning about the awesome scientific discoveries made possible by Maunakea — ignited our own spirits as we prepare for life after high school," Samantha Silva-Sampaio, one of the students, said in a statement.

The students also explain how the rest of the name fits in with their time at Gemini North. "Huki Pū," they say, has to do with the physical aspect of the two galaxies being pulled together, just like communities coming together to enable the discovery as a whole. And "i ke Ola" is meant to show that life can be created from interacting galaxies because this process gives rise to star birth, and hopefully we'll find a star besides the sun one day that hosts life on a world around it.

Why is it incredible?

The galaxy merger depicted in the image is formally known as NGC 7253 and is located around 200 million light-years from Earth in the constellation Pegasus. This region is also known as the Hawaiian constellation Ka Lupe o Kawelo.

What's especially spectacular about the image we see above is how sharply defined both galaxies appear during their gravitational interaction. It is also a treat to be able to live in a time when we can view an event happening so utterly far away with this much detail.

Galaxy mergers aren't a new thing, though. They occur all across the universe, and indeed even the Milky Way and our neighboring galaxy Andromeda are expected to collide (or maybe not?) at some point in the future. But not to fear — though it may not seem it from this image, within every galaxy is, well, a lot of space. So much so that it'd be surprising for anything in the colliding galaxies to actually smash together.

What does happen, however, is enchanting. All the interstellar gas and dust from both galaxies join together and lead to a spike in star formation. This means a ton of beautiful sparkles should decorate the final product of NGC 7253.

"'Uhane in this image reminds us that astronomy is not just science or spirit; it's both at the same time," Manu Silva-Sampaio, another one of the student discoverers, said in the statement.

Scientists detect signals of hydrogen from billions of years ago. Could this help us map out the universe?

4 September 2026 at 22:00

Astronomers have used the MeerKAT radio telescope to detect hydrogen gas billions of light-years away from us — from a period when the cosmos was billions of years younger than its current age of 13.8 billion years.

The research may provide astronomers with a new way of mapping the large-scale structure of the universe. The technique would rely on charting out where hydrogen, the universe's lightest and most abundant element, is located across the cosmos. It's known as hydrogen intensity mapping.

Neutral hydrogen emits a faint radio signal that astronomers call the 21-centimeter line. As the cosmos expands under the influence of dark energy, the wavelength of this radio signal is stretched, or "redshifted." The extremity of the redshift allows astronomers to determine how long a particular signal has been travelling to us and thus what period of the universe the hydrogen that emitted it existed in.

Using the 21-centimeter line, hydrogen intensity mapping allows astronomers to trace radio emissions from hitherto unseen galaxies and build a 3D picture of the largest structures in the universe. Up until this point, however, this technique has relied on combining radio wave detection with observations from galactic surveys operating with visible light, or electromagnetic radiation our eyes have evolved to see.

This new research defies that trend, building a hydrogen intensity map using radio waves detected by the MeerKAT radio telescope, made up of 64 antennas in the Meerkat National Park in the Northern Cape of South Africa.

"This is a very exciting milestone," team leader Sourabh Paul said in a statement. "Hydrogen intensity mapping has long been seen as a promising way to map the universe efficiently, but the signal is extremely faint and difficult to isolate from foreground emission, human-made radio-frequency interference, and instrumental effects.

"Detecting it directly with MeerKAT shows that this technique is becoming a practical tool for cosmology."

Mapping with MeerKAT

The team behind this research analyzed around 96 hours of MeerKAT observations, finding signals from hydrogen dating back 4 billion to 5 billion years. This hydrogen spans distances of many million light-years, similar to the distance between the Milky Way and our neighbor galaxy, Andromeda.

The achievement represents a step forward in the usefulness of hydrogen mapping.

"Neutral hydrogen is one of the key ingredients for understanding how galaxies form and evolve," team member Zhaoting Chen of the University of Edinburgh said in the statement. "With intensity mapping, we do not need to detect every individual galaxy. Instead, we can measure the collective signal from hydrogen across large cosmic volumes, giving us a new way to study both galaxy evolution and the underlying matter distribution of the universe."

Future cosmological surveys could greatly benefit from the advancement of hydrogen mapping. This will be a major factor when the Square Kilometre Array Observatory (SKAO), currently under construction in the Murchison region of Western Australia and the Karoo region of South Africa.

An overhead view of South Africa's MeerKAT radio-telescope array while it was under construction. The 64-dish network was inaugurated in July 2018.

An overhead view of South Africa's MeerKAT radio-telescope array. (Image credit: SKA South Africa)

"MeerKAT continues to open new windows for cosmology," team member Laura Wolz of the University of Manchester in the U.K. said in the statement. "The fact that this signal can be extracted from observations that were not originally designed for hydrogen intensity mapping is very encouraging. It shows the enormous scientific value of MeerKAT data and points the way to future observations with SKAO."

The team will now focus on collecting further observations with MeerKAT that cover larger areas of the sky over longer periods of time. This should provide astronomers with even more detailed hydrogen maps that could, in time, help understand how the largest structures in the cosmos took shape over the course of billions of years.

"This was a challenging data analysis process, requiring a detailed understanding of the many sources of contamination that can affect such a faint measurement," team member Mario G. Santos of the University of the Western Cape, Australia, said in the statement. "It is particularly remarkable that the data used in this study were taken in 2018, when MeerKAT had only just started science operations.

"There is now a rich trove of MeerKAT data waiting to be explored with this method."

The team's research was published in the July edition of The Astrophysical Journal Letters.

Hitchhiking PAHs Caught Catching a Ride on Galactic Winds

1 September 2026 at 17:00

IC 5332

Editor’s Note: Astrobites is a graduate-student-run organization that digests astrophysical literature for undergraduate students. As part of the partnership between the AAS and astrobites, we occasionally repost astrobites content here at AAS Nova. We hope you enjoy this post from astrobites; the original can be viewed at astrobites.org.

Title: JWST Discovery of Warm Dust in the Circumgalactic Medium of the Makani Galaxy
Authors: Sylvain Veilleux et al.
First Author’s Institution: University of Maryland
Status: Published in ApJ

The Windy Galaxy

Billions of light-years away lies Makani, a record-breaking galaxy discovered in 2019 by researchers at the Keck Observatory atop Maunakea, Hawaiʻi. The galaxy shows evidence of a large merger event, where two galaxies collided to form a larger galaxy. This event triggered starburst activity, or several waves of intense star formation, that changed the makeup of not just Makani, but the region around it.

There are several processes that can create galactic winds. An active supermassive black hole at the center of the galaxy can slingshot particles out of the galaxy at close to the speed of light, or supernovae leftover from previous starburst activity can help to expel material from the galaxy. Makani, whose name in Hawaiian just so happens to mean “wind,” has both factors contributing to its galactic winds: massive amounts of star formation and a very active black hole in its center.

This contributes to some of the strongest galactic winds discovered to date, stretching approximately 100 kiloparsecs (330,000 light-years) beyond the galaxy, roughly ten times the extent of a typical galactic wind. These galactic winds remove gas from the galaxy and help to enrich the circumgalactic medium around the galaxy. There is still much to discover about how galactic winds change the makeup of such galaxies, and what exactly they take with them on their way out.

Earth’s Favorite Carcinogen: Polycyclic Aromatic Hydrocarbons

Polycyclic aromatic hydrocarbons (PAHs, pronounced P-A-Hs or “paws”) are small flat dust grains scattered into every corner of the universe, from the atmosphere of Earth in the form of exhaust and wildfire smoke to the circumgalactic medium (the mostly empty space between galaxies). These PAHs contribute to regulating the temperature of the interstellar medium, but astronomers have long wondered how they migrate across galaxies.

Even though they are smaller than a human hair, PAHs are still easily observable even in very distant galaxies.  These dust grains emit infrared light, and if there are enough PAHs in a region, they are bright enough to be observed with modern telescopes, such as JWST. By combining multiple observations across multiple filters, astronomers can calculate ratios that reveal information about the PAHs’ size, temperature, and charge, allowing reserachers to further discern properties about the regions in which these PAHs reside.

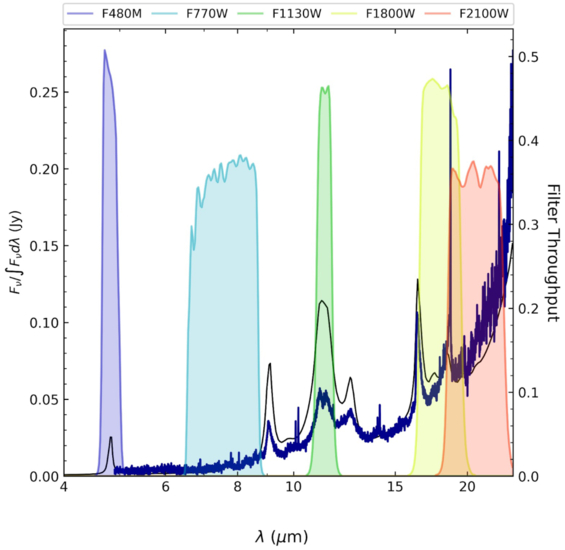
With redshifted galaxies like Makani, the light from PAHs is stretched beyond its usual wavelength, but fortunately for today’s authors, the light was stretched just enough to land known PAH features well within JWST filters, as seen in Figure 1. The authors were then able to use this information to track the distribution of these PAHs across Makani.

JWST spectrum of the galaxy Makani

Figure 1: Makani’s spectrum overlaid on top of the JWST filters. The peaks in the spectrum are PAH features that neatly overlap with JWST’s observing bands. [Veilleux et al. 2025]

PAHs Gone Extragalactic

Using JWST, the authors scrutinized Makani for any signs of PAHs. They found that not only did PAHs exist within the galaxy, these molecules were found up to 30 kpc (~100,000 light-years) outside the galaxy. Makani’s strong galactic winds were ejecting the dust grains from the galaxy over an estimated timescale of a billion years.

Previously, astronomers had not expected to find high quantities of dust grains outside the protection of a galaxy. The journey across a galaxy is long and hot, with temperatures in the millions of degrees. A dust grain would likely not survive the trip, as it would be destroyed by high-energy photons. This suggests that the PAHs were somehow shielded from the hotter parts of the interstellar medium and circumgalactic medium in large enough volumes to make it beyond the edge of Makani.

This answered questions about how galaxies enrich the circumgalactic medium, but it also added several more. Since today’s authors were limited by the sensitivity and range of their instruments, they were unable to confirm if there were PAHs along Makani’s entire wind structure, or just the first 35 kpc (114,000 light-years) of it. They also would like to turn their sights towards the intergalactic medium to see if PAHs could make it even farther beyond the reach of their host galaxy.

Original astrobite edited by Chloe Klare.

About the author, Natalie Price:

As a first-year master’s student at Wesleyan University, I study how stellar winds interact with the local interstellar medium. Outside of the observatory, you can find me dancing, with my nose in a book, or running at non-relativistic speeds.

The post Hitchhiking PAHs Caught Catching a Ride on Galactic Winds appeared first on AAS Nova.

‘Little Red Dots’ Remain a Cosmic Mystery—and New Research Reveals They May Be Keeping a Very Big Secret

26 August 2026 at 14:03

Little red dots, an astronomical mystery unveiled by NASA’s James Webb Space Telescope, have perplexed researchers since their discovery—and now, according to new findings, we may be closer than ever to unraveling their mystery.

According to new research that appeared in Nature Astronomy, the enigmatic little red dots could be residents of very small, but also very dense galaxies with masses close to a billion times our Sun’s mass.

If confirmed, the new research may set the pace for unraveling how these cosmic curiosities, first detected in 2023, first came to be in the early stages of the universe’s development. Not only that, it could hint at the possibility that these “little” cosmic curiosities may also be keeping a big secret.

What Are Little Red Dots?

One of the reasons little red dots remained unknown until recent years has to do with their great distances from Earth. With the help of the Webb telescope’s powerful eye, these tiny objects were initially detected three years ago and detailed in a formal scientific paper in 2024.

The nature of these objects remains unknown, and astronomers still aren’t certain about what the exact source of the light they produce might be. In past research, some clues have pointed to the possibility of material around these objects at ultraviolet wavelengths—this would potentially offer a strong hint that these faint, distant objects are galaxies, or are at least related to them in some way.

One of the challenges astronomers have encountered is the lack of optical light measurements indicating the presence of galactic material. Because of this, questions remain about the mass that could be present in stellar bodies associated with the little red dots.

Capturing Optical Emissions from Enigmatic Objects

Now, in new research by Xuheng Ding, Lilan Yang, and colleagues, imagery captured by the James Webb Space Telescope of 217 examples of little red dots has produced new clues about their mysterious origin.

A key component of the new imagery includes the detection of optical emissions, albeit faint ones, observed beyond the primary central objects themselves. The detections are strong enough to be clearly observed, and based on the team’s models, these emission lines are indeed most likely linked to the presence of stellar mass, meaning that the little red dots are good candidates for star-forming galaxies, as many astronomers have suspected.

If correct, this would help confirm a potentially big secret about these objects, since it would also mean the little red dots reside at the centers of these galaxies—as supermassive black holes.

Anatomy of a Little Red Dot

Additional clues about these objects include new estimates for their size, clocking in with a radius of about 210 parsecs—roughly 685 light-years—on average. This means that the little red dots are far more compact than the kinds of star-generating galaxies expected to possess comparable mass, which date to around the same time in our universe’s development that the dots are believed to originate.

Based on the new research, little red dots are more than just unusual light sources in the distant universe, and their likely association with star-forming galaxies offers a significant clue toward revealing their exact nature.

Still, a few questions remain, and the team cautions that their analysis deals with the average properties based on the recent collection of Webb imagery of these cosmic features, since many of the individual characteristics of the little red dots remain too faint to characterize on an individual basis.

Going forward, the team believes additional observations that include spectrographic analysis of the light produced by little red dots will offer more clues about not only their origins, but will also help astronomers determine clearer estimates for their distances.

The recent study, “Extended components of little red dots in the rest-frame optical,” appeared in Nature on August 24, 2026.

Micah Hanks is the Editor-in-Chief and Co-Founder of The Debrief. A longtime reporter on science, defense, and technology with a focus on space and astronomy, he can be reached at micah@thedebrief.org. Follow him on X @MicahHanks, and at micahhanks.com.

Dark matter influences the size of galaxies

24 August 2026 at 12:00

In the 1970s, astronomer Vera Rubin analyzed a series of observations of how quickly different galaxies rotated around their centers. She found that these galaxies rotated much faster than they should have, given the amount of material visible through starlight. She concluded that a large fraction of these galaxies’ masses must therefore consist of some kind of unseen material.

Scientists have since observed galaxies to more precisely measure this unseen material, which they now call dark matter. They’ve shown that dark matter moves much more slowly than the speed of light. Unlike most celestial objects, it can’t emit or block any light, meaning it doesn’t interact with the electromagnetic force. Even though it doesn’t interact with a fundamental force in the universe, dark matter constitutes over 80% of the mass of an average galaxy.

In the prevailing model of cosmology, known as ΛCDM (pronounced “Lambda-CDM”), dark matter determined where galaxies formed. The theory is that gravity pulled dark matter together more quickly than regular matter in the primordial universe. This redistribution led to regions of space with greater mass density, which collected chaotic, regular matter into pools that eventually formed galaxies, stars, and planets. 

In the present universe, dark matter and regular matter coexist in galaxies, though generally separated. Regular matter pools in the very center of galaxies, forming the more familiar galactic disks. Dark matter stays towards the edges of galaxies, enveloping the regular matter disks in what are known as dark matter halos. Because these halos make up so much of the mass of the average galaxy, researchers Guangze Sun, Fangzhou Jiang, and Jing Wang conducted a series of simulations to test how dark matter halos affect regular matter in galaxies. Specifically, they examined what characteristics of dark matter halos determine galaxy sizes. 

The force of gravity works such that more massive dark matter halos draw in more regular matter and produce larger galaxies. So these researchers fixed the total mass of the galaxies they simulated at 100 billion times that of the Sun to determine which properties of the dark matter halos would produce the widest galaxies. They selected 4 variables to test: the total density of dark matter in the galactic halo, the density of dark matter in the innermost 1% of the halo, how fast the halo spun, and the ratio of regular matter to dark matter in the entire galaxy. For each variable, they tested 3 to 4 inputs representing low, moderate, and high values against a standard reference value and ran 132 total simulations to generate enough data for statistical analyses.

To simulate the complex physics of dark matter halos, the team used the modeling software GIZMO to model gravity, magnetism, and fluid dynamics. They combined this with a second model, called FIRE-3, which modeled how stars explode at the end of their lives, how much metal these explosions produce, and how gases heat up and cool down over time. The researchers ran the dynamic simulations for 3 billion model years, then used a program they developed based on the existing Pynbody to measure the radii of the simulated galaxies. 

The team found that the faster a dark matter halo spun around a simulated galaxy, the larger the galaxy became, as shown in scenario 1 in the figure below. By contrast, in scenario 2, increasing the halo’s total dark matter concentration caused the central galaxy to shrink. Increasing only the innermost dark matter density in the halo had a smaller effect but generally reduced the galaxy’s size, as shown in scenario 3. And lastly, increasing the ratio of regular matter to dark matter in galaxies resulted in smaller galaxies that formed stars closer to their centers, as shown by a greater concentration of stars in scenario 4. 

This diagram showcases the team’s results separated into 4 broad scenarios. The left column depicts a default galaxy under the baseline parameters. The right column depicts how the galaxies changed when the team varied a single experimental factor, including 1) increasing how fast the dark matter halo spun, 2) increasing the total density of the dark matter halo, 3) increasing the density of dark matter in the innermost halo, and 4) increasing the ratio of regular matter to dark matter in the entire galaxy. The dark matter haloes are represented as red rings surrounding the galaxies, not to scale. Illustration by Andrew Bizal.

This diagram showcases the team’s results across 4 broad scenarios. The left column depicts a default galaxy under the baseline parameters. The right column depicts how the galaxies changed when the team varied a single experimental factor, including 1) increasing how fast the dark matter halo spun, 2) increasing the total density of the dark matter halo, 3) increasing the density of dark matter in the innermost halo, and 4) increasing the ratio of regular matter to dark matter in the entire galaxy. The dark matter haloes are represented as red rings surrounding the galaxies, not to scale. Illustration by Andrew Bizal.

The team’s results suggest a previously unknown connection between the properties of dark matter halos and galactic disks. However, they cautioned that their simulations were all run on galaxies in isolation, unlike in the actual ΛCDM universe, where their interactions are complicated by galaxies tugging on one another or by material moving from one to another. To further test their results for single galaxies, the researchers plan to run follow-up experiments with halos of different sizes, as well as with galaxies with different shapes and features, such as clumps, gaps, and lopsidedness.

The post Dark matter influences the size of galaxies appeared first on Sciworthy.

Galaxies of Many Colors

18 August 2026 at 17:00

Messier 83

Editor’s Note: Astrobites is a graduate-student-run organization that digests astrophysical literature for undergraduate students. As part of the partnership between the AAS and astrobites, we occasionally repost astrobites content here at AAS Nova. We hope you enjoy this post from astrobites; the original can be viewed at astrobites.org.

Title: Unbreaking the Universe: MINERVA Measurements of Color Gradients in Massive Quiescent Galaxies Can Help Ease Too-Early Star Formation Tensions
Authors: Sam E. Cutler et al.
First Author’s Institution: Tufts University
Status: Published in ApJL

Universe Breakers

JWST launched in 2021, and one of its key goals was to observe the first galaxies as they formed. Early results from JWST found something surprising: extremely massive galaxies in the early universe that had “quenched,” or stopped making new stars, much faster than was expected. These early results led some to believe that our understanding of how quickly massive galaxies can form and quench was fundamentally wrong.

Before concluding that our understanding of the universe is broken, it’s important to find other reasons why we might see very massive galaxies in the early universe. One theory is that these galaxies are actually less massive than we think. To “weigh” a galaxy, astronomers first measure the amount of light being emitted by that galaxy. If all the light in a galaxy comes from stars (which should be true in the early universe, though active black holes can contribute a lot of light in some galaxies), you can infer the total number of stars by accounting for the average amount of light emitted per star of a certain mass; this is called the “mass-to-light ratio.” Since massive stars emit a lot more light than low-mass stars, and high-mass stars die out faster than low-mass stars, the mass-to-light ratio is higher for older stellar populations. To accurately “weigh” a galaxy, scientists therefore need both a good measurement of the total amount of light in the galaxy and how old its stellar population is. The authors of today’s article suggest that the uncertainty in these measurements might be leading to overestimates of galaxy masses and underestimates of galaxy star formation rates, possibly explaining the existence of the earliest massive quiescent (non-star-forming) galaxies.

The Impact of Color Gradients

Previous works about the massive quiescent galaxies in this study used spectroscopy to determine the galaxies’ masses and star formation rates. These spectra were taken with a “slit,” which introduces a source of error: if the slit is smaller than the image of the galaxy, some of the galaxy’s light will be missed in the spectrum. Astronomers usually correct for this by checking how much of the total light of a galaxy image is covered by the slit and scaling up the spectrum to account for the missing light, but this correction assumes that the spectrum is basically the same across the entire galaxy.

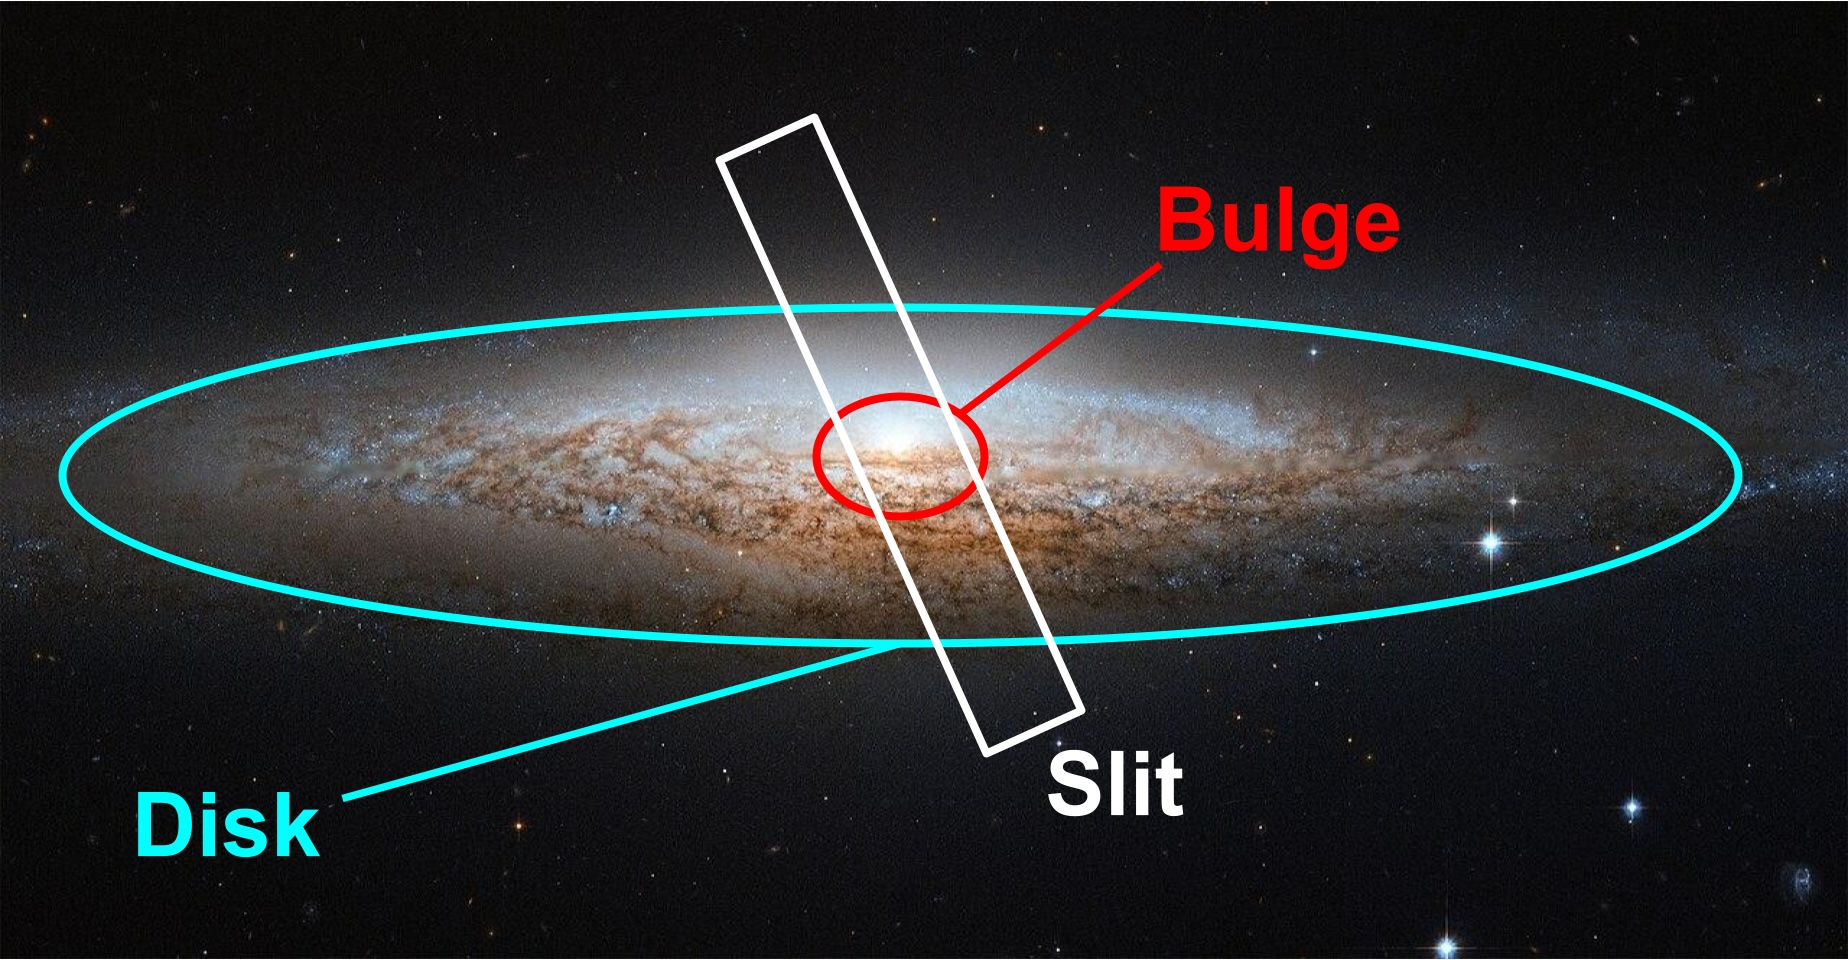
However, this assumption is rarely correct. In the local universe, star-forming spiral galaxies like the Milky Way tend to be made of a central “bulge” surrounded by a “disk” (see Figure 1). The bulge is no longer actively forming new stars, leading to a red-to-blue color gradient as you move out from the center of the galaxy. In astronomy, this is considered a “negative” color gradient. A slit that only covers the galaxy center would lead to an overall overestimate of the stellar mass and underestimate of the star formation rate. If the galaxies instead had a positive color gradient, with more star formation in the center of the galaxy, the mass would be underestimated and the star formation rate would be overestimated. Galaxies with both positive and negative color gradients have been found in the distant universe. By measuring the color gradient for each individual galaxy in their sample, the authors can correct the mass and star formation rate calculations from spectra taken with a slit spectrograph.

NGC 2683 with annotations

Figure 1: The spiral galaxy NGC 2683 with its bulge and disk labeled. The inner part of the galaxy (“bulge”) contains older, redder stars; the outer part of the galaxy (“disk”) contains bright blue stars that indicate that star formation is ongoing. Here, the slit spectrograph only covers the galaxy’s bulge, leading to incorrect mass and star formation rate measurements. [ESA/Hubble & NASA (CC BY 4.0) with annotations by Margaret Verrico]

Results

Instead of using spectra, the authors of today’s article use imaging in different filters to measure color gradients for a sample of four galaxies in the early universe that had previously been found to be extremely massive and no longer forming stars. They use medium-band filters, or filters that let in only a small part of a galaxy’s spectrum, to produce a spectral energy distribution at each radius. This spectral energy distribution is less informative than a spectrum (think a handprint versus a fingerprint), but it’s detailed enough to model the likely stellar population at each radius to determine whether the galaxies have positive, negative, or no color gradients, allowing for better corrections to the properties measured from the galaxies’ centers. They also model the stellar population from the central part of the galaxy that would normally be covered by a slit, as well as from the actual spectrum, to test whether any differences in their results come from their choice of modeling techniques.

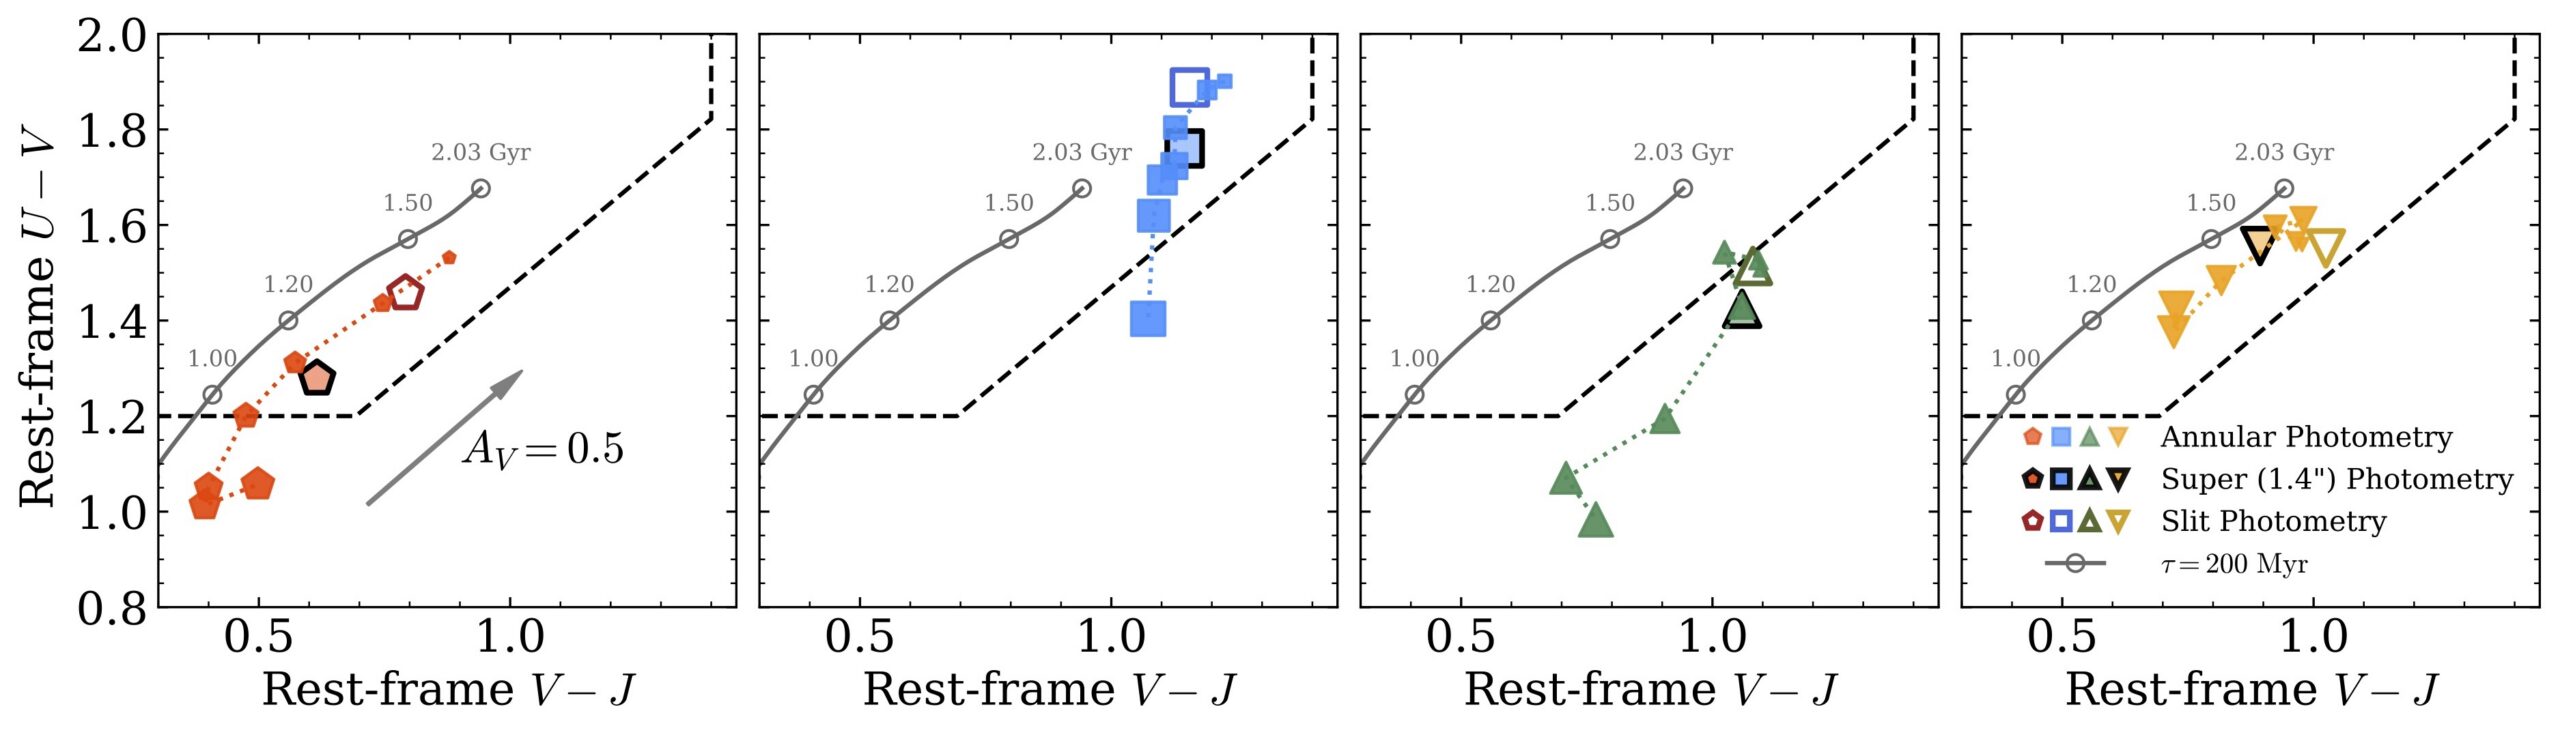
The authors find that three of the four galaxies have a negative color gradient in at least some areas. The fourth galaxy has a relatively flat color gradient, though this measurement is less certain due to the object’s redshift. When the authors plot the galaxies’ colors on a diagnostic diagram that separates red and old galaxies from young and blue galaxies, they find that three of the four galaxies have centers that appear red and old but outskirts that appear young and blue (Figure 2). This means previous measurements of the mass may have been overestimated, and previous measurements of the star formation rate may have been underestimated.

color-color diagram for the galaxies studied

Figure 2: The location of each of the four galaxies on a color–color diagram that separates red galaxies (above/to the left of the dashed lines) from blue galaxies (below/to the right of the dashed lines). The open markers indicate the galaxy color as measured from the center of the galaxy; the filled-in markers show the color at different radii from the galaxy center. For all but one galaxy, the color at several radii is bluer than at the center, indicating that the galaxy might have younger stars at least at some radii. [Adapted from Cutler et al. 2026]

Next, the authors model the stellar ages across the galaxies using spectral energy distribution modeling. This technique compares the measured spectral energy distribution to libraries of stellar spectra, rules about how different dust or chemical composition impact galaxy appearance, and observational effects to predict the actual stellar makeup of a galaxy. In this case, the authors can’t know for sure whether the redder colors at galaxy centers come from an older stellar population, more dust, or changes in the chemical composition (the so-called “dust–age–metallicity degeneracy”). To account for this, the authors try modeling the stellar population two ways: once by assuming all change in color comes from a change in stellar age, and again by allowing the dust and chemical composition of the galaxy to change with radius. They find that if only the stellar age varies across the galaxy, age gradients in the galaxy stellar population can bring the estimated galaxy masses and star formation rates back toward agreement with models of galaxy evolution in the early universe, though not all the way. However, allowing dust and chemical composition to change across the face of the galaxy lead to higher stellar masses and less star formation, meaning the mystery may not yet be solved.

Is the Universe Broken?

To determine whether these galaxies still count as “universe breakers,” the authors use a cosmological model to predict the largest expected galaxy mass in the observed area at different periods in cosmic time. The previous results had less than a 0.3% chance of occurring under current cosmological models; with their updated numbers and stellar population models, the authors find that the observed galaxies sometimes have more than a 5% chance of occurring, though there is still tension. They point out that their analysis ignores processes that could help galaxies grow and quench in the early universe, like galaxy mergers; still, the existence of these massive galaxies with such low star formation rates remains a puzzle.

Original astrobite edited by Ansh Gupta.

About the author, Margaret Verrico:

I am a fourth-year graduate student at the University of Illinois Urbana-Champaign. I study the connection between supermassive black hole transients and their host galaxies. I am also an avid knitter and reader, and I am passionate about opening up STEM opportunities for people of all backgrounds.

The post Galaxies of Many Colors appeared first on AAS Nova.

A Lyman-Leaking Galaxy Merger Confirmed with JWST

14 August 2026 at 19:43

Epoch of Reionization

Exactly how the universe became reionized after cooling to form stars and galaxies remains an open question. A recent study investigates how a merging set of galaxies may have spurred an onslaught of ionizing photons into the intergalactic medium.

Lyman Continuum Leakers and Merging Galaxies

After its chaotic and blistering beginning, the universe cooled and began to coalesce, stars and galaxies flickering on to set the universe alight. From a few hundred million to about a billion years after the Big Bang, galaxies pumped high-energy ionizing Lyman continuum (LyC) photons into the intergalactic medium during what is known as the epoch of reionization. The exact mechanisms that produced and allowed LyC emission to escape galaxies during this era remain elusive.

Galaxy Merger

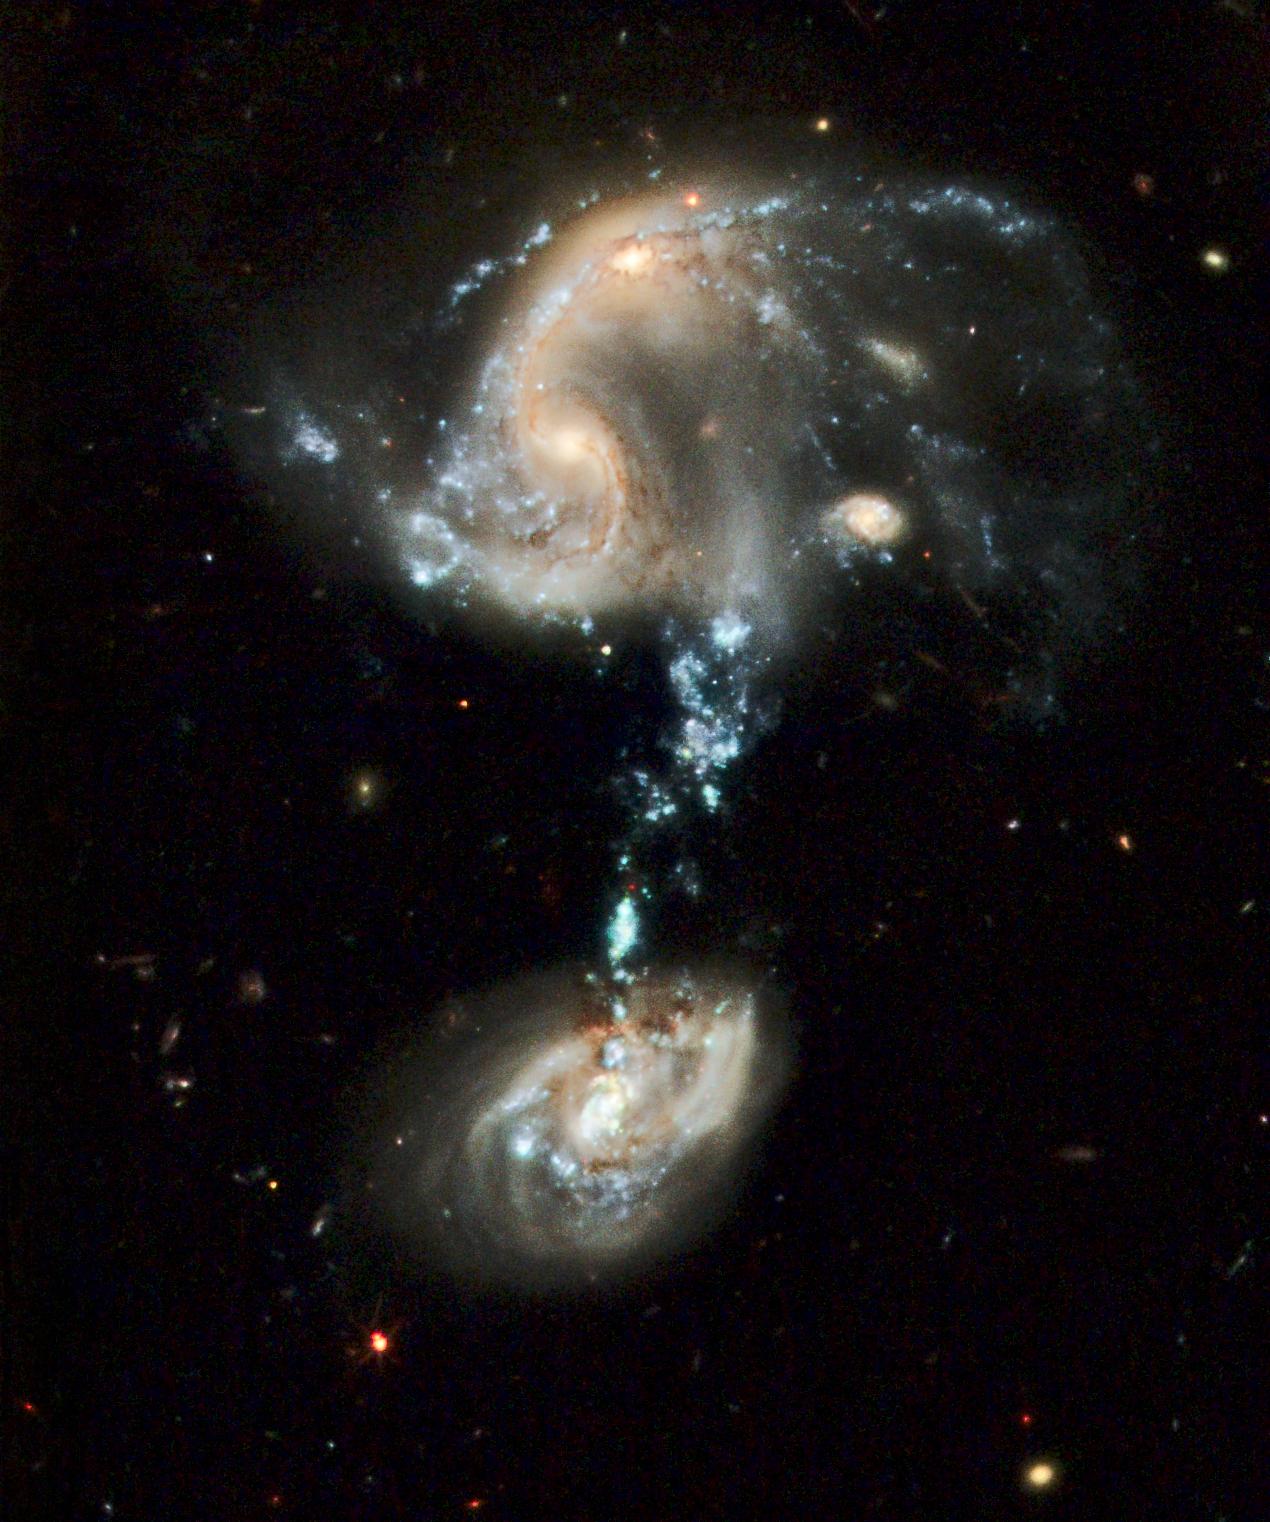
Hubble Space Telescope image of the interacting galaxy group Arp 194. The blue stream connecting the galaxies is where tidally stripped gas formed millions of new stars. [NASA, ESA, and the Hubble Heritage Team (STScI/AURA)]

One promising driver of LyC leakage is galaxy mergers — strong gravitational interactions and interstellar medium mixing can induce bursts of star formation, creating the hot, young stars that emit LyC photons. In particular, galaxy mergers can create tidal tails, streams of wispy gas, that can sustain brief but intense bouts of star formation that quickly use up surrounding gas. With no interstellar gas left to absorb radiation, the fresh stars in these streams can easily pump their high-energy photons into the intergalactic medium, contributing to cosmic reionization.

While observational studies have increasingly pointed to galaxy mergers as considerable drivers of LyC escape, only a small number have explicitly considered the role of mergers in the epoch of reionization due to spectral and spatial resolution limitations. Leveraging the high-resolution capabilities of JWST, Shengzhe Wang (University of Chinese Academy of Sciences; National Astronomical Observatories, Chinese Academy of Sciences) and collaborators performed detailed analyses of two LyC-leaker candidates to better understand the role of galaxy mergers in heating up the universe.

Confirming (and Refuting) Merger-Driven Leaks with JWST

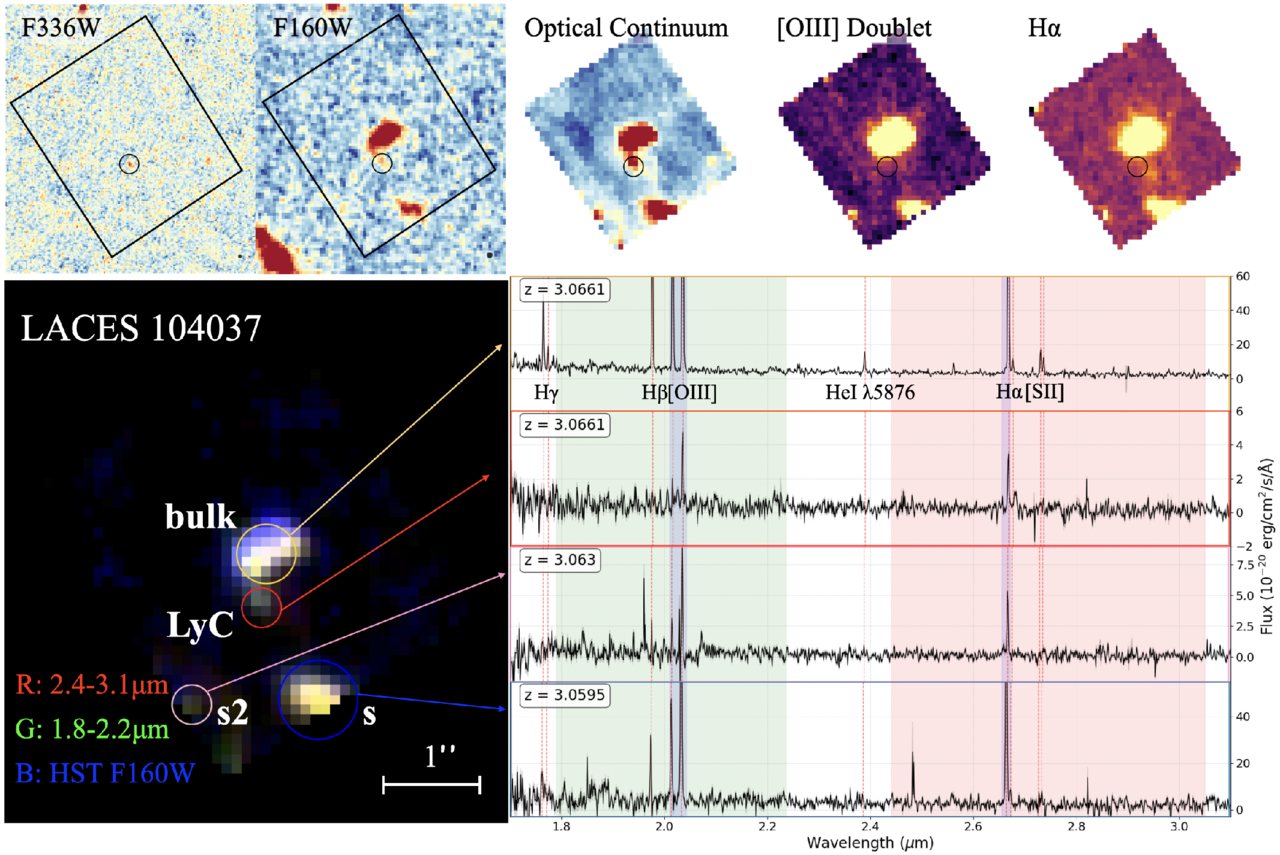
Using candidate LyC leakers first identified in the LymAn Continuum Escape Survey (LACES) carried out with the Hubble Space Telescope, Wang and team obtained high-resolution JWST spectroscopy for two galaxies at redshift z = 3.1 (about 2 billion years after the Big Bang), LACES94460 and LACES104037. After carefully identifying and measuring emission lines in each candidate, the authors confirmed LACES104037 as a merger-driven LyC leaker. However, the apparent LyC emission from LACES94460 was determined to be contamination from a low-redshift object.

LACES 104037

Hubble and JWST observations of LACES104037. The top panels show the Hubble images (first two panels) and the JWST spectral observations (last three panels). The bottom panel shows a composite three-color image marking the location of two primary interacting galaxies and the LyC emission along with the associated spectra. Click to enlarge. [Wang et al 2026]

Based on the JWST spectroscopy, LACES104037 is an early-stage merger system with two primary interacting galaxies (LACES104037-bulk and LACES104037s) with a tidal-tail structure connecting them (LACES104037-LyC) where the LyC emission originates. Using model predictions based on the JWST spectroscopy and photometry from previous studies, the team found that LACES104037-LyC is a star-forming clump in a tidal tail with a stellar age of about 5 million years and an extreme LyC photon escape fraction of approximately 0.99. This points to merger-induced star formation being an extremely efficient way to dump ionizing photons into the intergalactic medium.

LACES104037-LyC represents the first confirmed LyC leaker of its kind: an external clump of star formation in a tidal tail. This discovery aids in our understanding of how mergers can drive high-energy photon emission, and highlights the critical role galaxy mergers may play in the epoch of reionization. Future high-resolution observations will hopefully reveal more knots of LyC-leaking stars within merging galaxies and provide a deeper understanding of this important evolutionary phase of the universe.

Citation

“Confirmation and Refutation of Lyman Continuum Leakers at z ~ 3 with JWST NIRSpec IFU,” Shengzhe Wang et al 2026 ApJL 1006 L17. doi:10.3847/2041-8213/ae8523

The post A Lyman-Leaking Galaxy Merger Confirmed with JWST appeared first on AAS Nova.

❌