❌

Normal view

Spying on a Split Comet

31 July 2026 at 17:00

240P

Traversing through the solar system, a comet split in two, and a recent study used six months of observations to investigate when and why.

A Split Comet
Orbit map

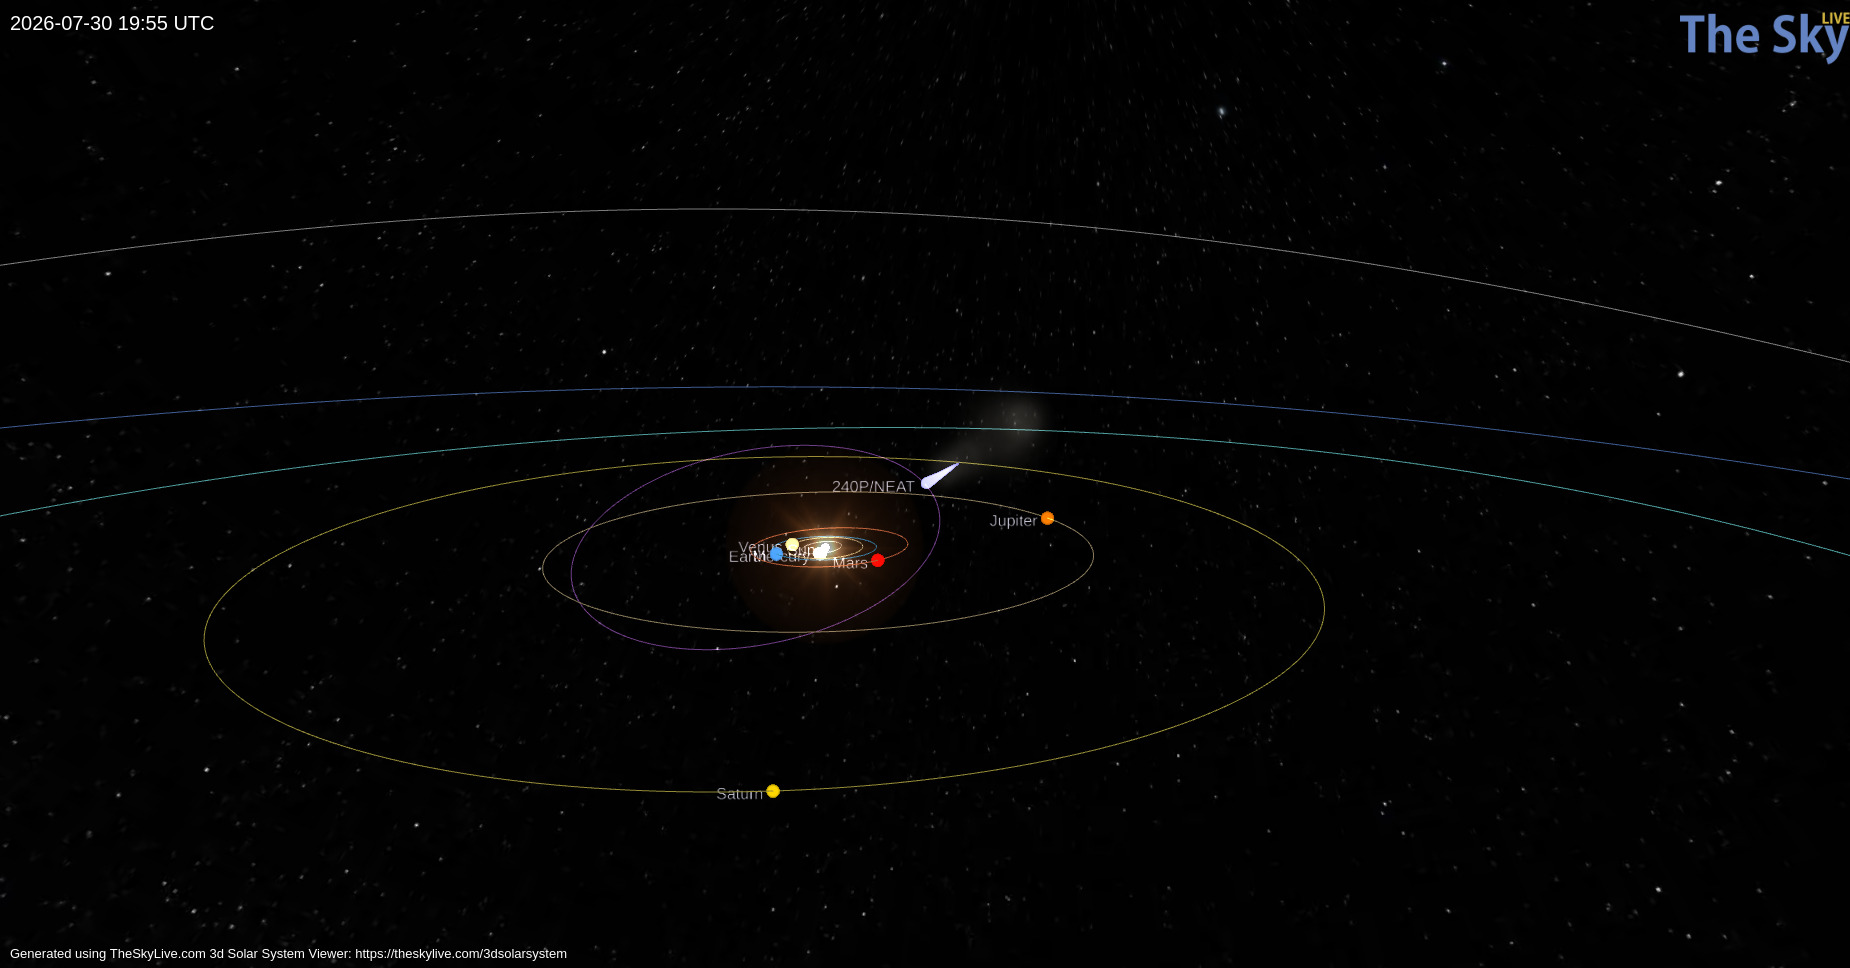
Orbital path of 240P/NEAT (purple) and the position of the comet on 30 July 2026 (light blue teardrop). Click to enlarge. [TheSkyLive]

While we often think of comets as icy remnants of the solar system’s formation that populate the Kuiper Belt and Oort Cloud, some comets make their homes closer to the Sun. One such class, known as Jupiter-family comets, traveled from the Kuiper Belt to short orbital periods (less than 20 years) whose paths through the solar system are shaped by Jupiter’s gravity. Discovered in 2002, 240P/NEAT is a Jupiter-family comet that loops between Jupiter and Mars on a 7.6-year orbit. Making close approaches to Jupiter, 240P experiences frequent, strong interactions with the gas giant that can alter the comet’s orbit and cause sudden bursts in brightness as ice and dust are heated and outgassed from the comet’s surface.

Most recently, 240P swept closest to Jupiter in July 2007, shifting the comet’s perihelion distance (closest approach to the Sun) from 2.5 to 2.1 au, and several long-lived bursts in brightness in 2018/2019 could have been spurred by this orbital shift. Excitingly, a fainter comoving object, 240P-B, was first reported in June 2025 as the comet headed toward perihelion — at some point recently, 240P had split in two!

Over the last century, numerous split comets have been recorded, but detailed physical studies of these objects are rare. With growing evidence suggesting splitting and disintegration are the primary mechanisms of comet destruction, understanding the properties and cause of 240P’s split is imperative.

Observing 240P

With 240P on the move to perihelion, David Jewitt (University of California, Los Angeles) and collaborators monitored the comet from October 2025 to April 2026 to establish the likely cause of its split. Employing the Alhambra Faint Object Spectrograph and Camera on the 2.56-meter Nordic Optical Telescope, the authors obtained detailed imaging of the comet from two months before to four months after perihelion to characterize both components.

Tracking both photometric and morphological changes across their observations, the authors estimated the dust-loss rates, physical sizes, and separation speed of 240P-A and 240P-B. The brighter component, 240P-A, has an estimated radius between 400 and 600 meters and a dust-loss rate almost four times higher than 240P-B. Because 240P-B is fainter, its radius is harder to constrain observationally. From its lower dust-loss rate and lower brightness, the authors estimated a radius around 300 meters (and no smaller than 50). Based on how the separation of the two comet pieces changes over time, the authors determined that the split of 240P occurred at least three years before their observations.
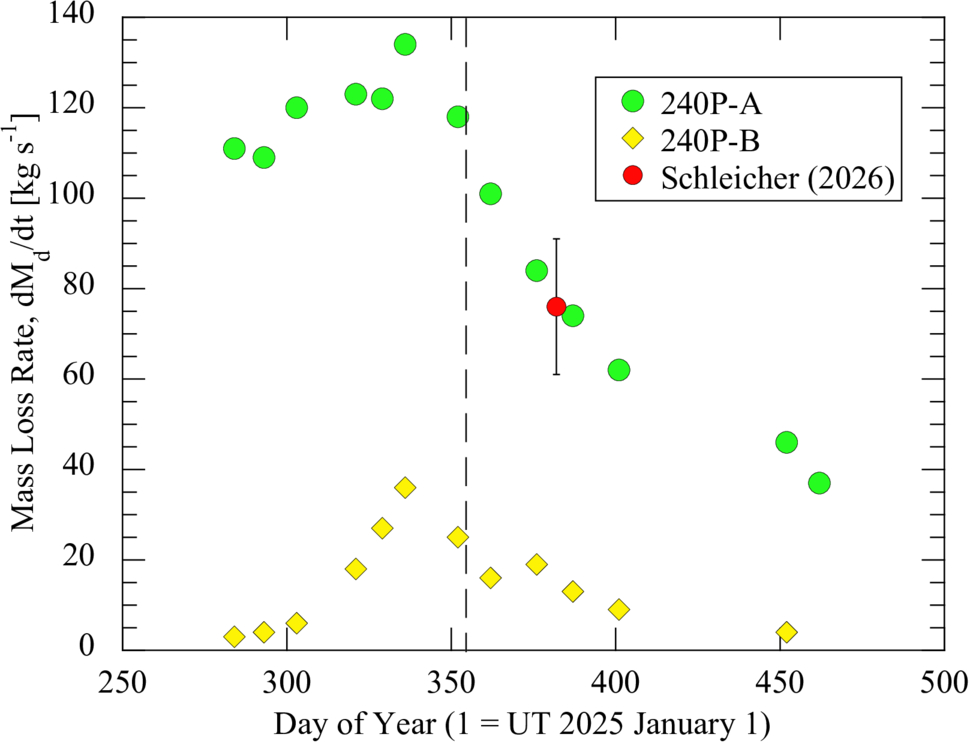
dust mass-loss

Dust mass-loss rates for 240P-A (green circles) and 240P-B (yellow diamonds) over the course of the observations. Both components peak shortly before perihelion (dashed vertical line). Click to enlarge. [Jewitt et al 2026]

Source of the Split

How exactly did this fragmented comet get this way? The authors considered a number of comet-splitting mechanisms: tidal forces, asteroid impact, pressure buildup below the comet’s surface, thermal stresses, and rotational instability. Given the comet’s orbit, it has not had close enough encounters with the Sun or other planets for tidal forces to be the culprit, and it traverses well above the asteroid belt, avoiding collisions. Pressure buildup and thermal stresses can fracture comets, but both are unlikely to launch such a large fragment as seen in this system.

This leaves rotational instability as the likely source of 240P’s split. Outgassing torques lead to rotational instability, especially in subkilometer comets like 240P, and 240P has exhibited recent outgassing. In addition, the separation speed between the 240P components is comparable to the escape speed of the primary comet, which is expected for rotational breakup. To confirm this hypothesis, future observations measuring the rotation period of 240P are necessary, but this study adds to the small number of split-comet observations that aid in understanding comet destruction.

Citation

“Investigation of Split Comet 240P/NEAT,” David Jewitt et al AJ 172 113. doi:10.3847/1538-3881/ae83ac

The post Spying on a Split Comet appeared first on AAS Nova.
Monthly Roundup: The Fourth Catalog of Gravitational Wave Events from LIGO, Virgo, and KAGRA

29 July 2026 at 17:00

Illustration of gravitational waves emanating from a pair of black holes approaching a merger

A recent Focus Issue of the Astrophysical Journal Letters describes the fourth version of the catalog of gravitational wave events (GWTC-4.0) from the Laser Interferometer Gravitational Wave Observatory (LIGO), the Virgo interferometer, and the Kamioka Gravitational Wave Detector (KAGRA).

This catalog contains transient gravitational wave events recorded through January 2024, during the observatories’ fourth observing run, which concluded in November 2025. GWTC-4.0 displays the results of significant improvements to our suite of gravitational wave detectors, including higher-powered lasers and reduced quantum noise. A fifth catalog of gravitational wave events was released in Spring 2026, with the accompanying scientific articles being submitted to the Astrophysical Journal and the Astrophysical Journal Letters.

This Monthly Roundup consists of short descriptions of each of the currently published research articles in the LIGO–Virgo–KAGRA Gravitational Wave Transient Catalog (GWTC): Release 4 Focus Issue. Each snippet links to the corresponding research article, and the Focus Issue landing page is linked at the bottom of this post. Be sure to revisit the landing page to catch new articles as they’re published!

Introducing GWTC-4.0

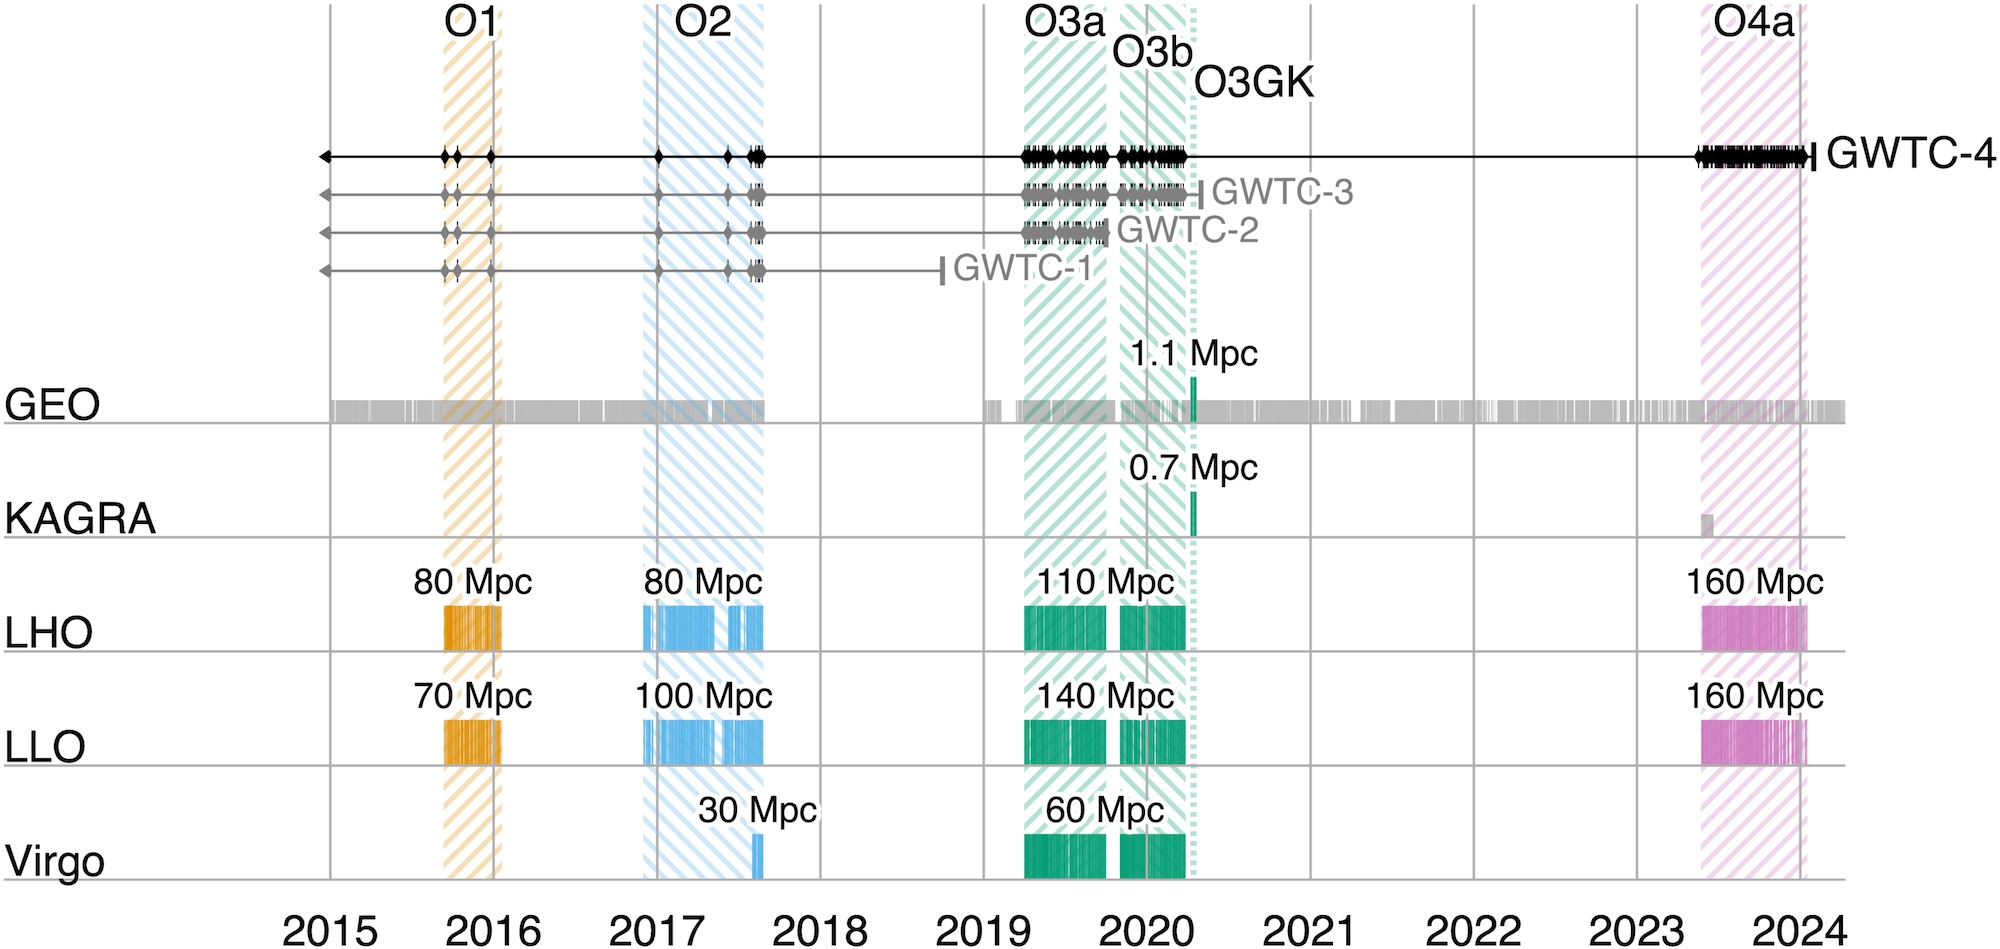
timeline of gravitational wave observatories' observing runs

A timeline showing observing runs between 2015 and 2024. Click to enlarge. [LVK Collaboration 2025]

First up, the collaboration orients the reader to many important aspects of the catalog and the articles contained in the Focus Issue. This article describes how four detectors, each with two arms 3–4 kilometers long, monitor gravitational waves from Hanford, Washington; Livingston, Louisiana; Santo Stefano a Macerata, Italy; and Hida, Japan. These detectors work in concert, ready to receive signals from the universe during coordinated observing runs separated by periods of downtime for construction and commissioning. During these pauses, a smaller instrument, the German–British GEO600 gravitational wave detector, has kept an ear out for signals and will continue to do so until the end of 2026.

After these detectors record subtle spacetime squiggles from compact objects colliding millions to billions of light-years away, the collaboration converts the raw signals into the data contained in catalogs like GWTC-4.0. This process involves modeling the gravitational wave signals, filtering them to identify candidate transients, and pinpointing the most significant events.

After collecting and cleaning the signals, the collaboration undertakes a critical step: making their data accessible to researchers and the public. The data are available through the Gravitational Wave Open Science Center, and the Focus Issue article on open data describes how to navigate the online portal, how the datasets archived online are structured, and how the data were calibrated.

Science Results

This fourth version of the gravitational wave transient catalog greatly expands the sample of gravitational wave transients recorded by detectors across the globe. Including events from previous catalogs, GWTC-4.0 brings us to 218 events for which the probability of the source being astrophysical in nature is more than 50% and for which there is little chance of the signal being an instrumental artifact. This represents a more than 100% increase in the number of recorded gravitational wave events fulfilling this criterion, broadening our understanding of colliding compact object pairs. This release also includes some superlative signals, such as the most massive black hole binary with a low false-alarm rate and the highest signal-to-noise ratio for a gravitational wave event thus far.

Detected in November 2023 by both LIGO Hanford and LIGO Livingston, GW231123 is in many ways an exceptional gravitational wave transient. The total mass of the merging components appears to be between 190 and 265 solar masses, and the false-alarm rate for this signal is less than one per year. This makes it the most massive merger event with such a low false-alarm probability. The two components also appear to have high spins, which complicates the interpretation of the signal with existing models. A binary black hole merger in which one or more components lies within the pair-instability mass gap is the likeliest explanation for this signal, but the authors also present alternative scenarios, such as a core-collapse supernova or a gravitationally lensed gravitational wave signal.

GW230814 gravitational wave signal

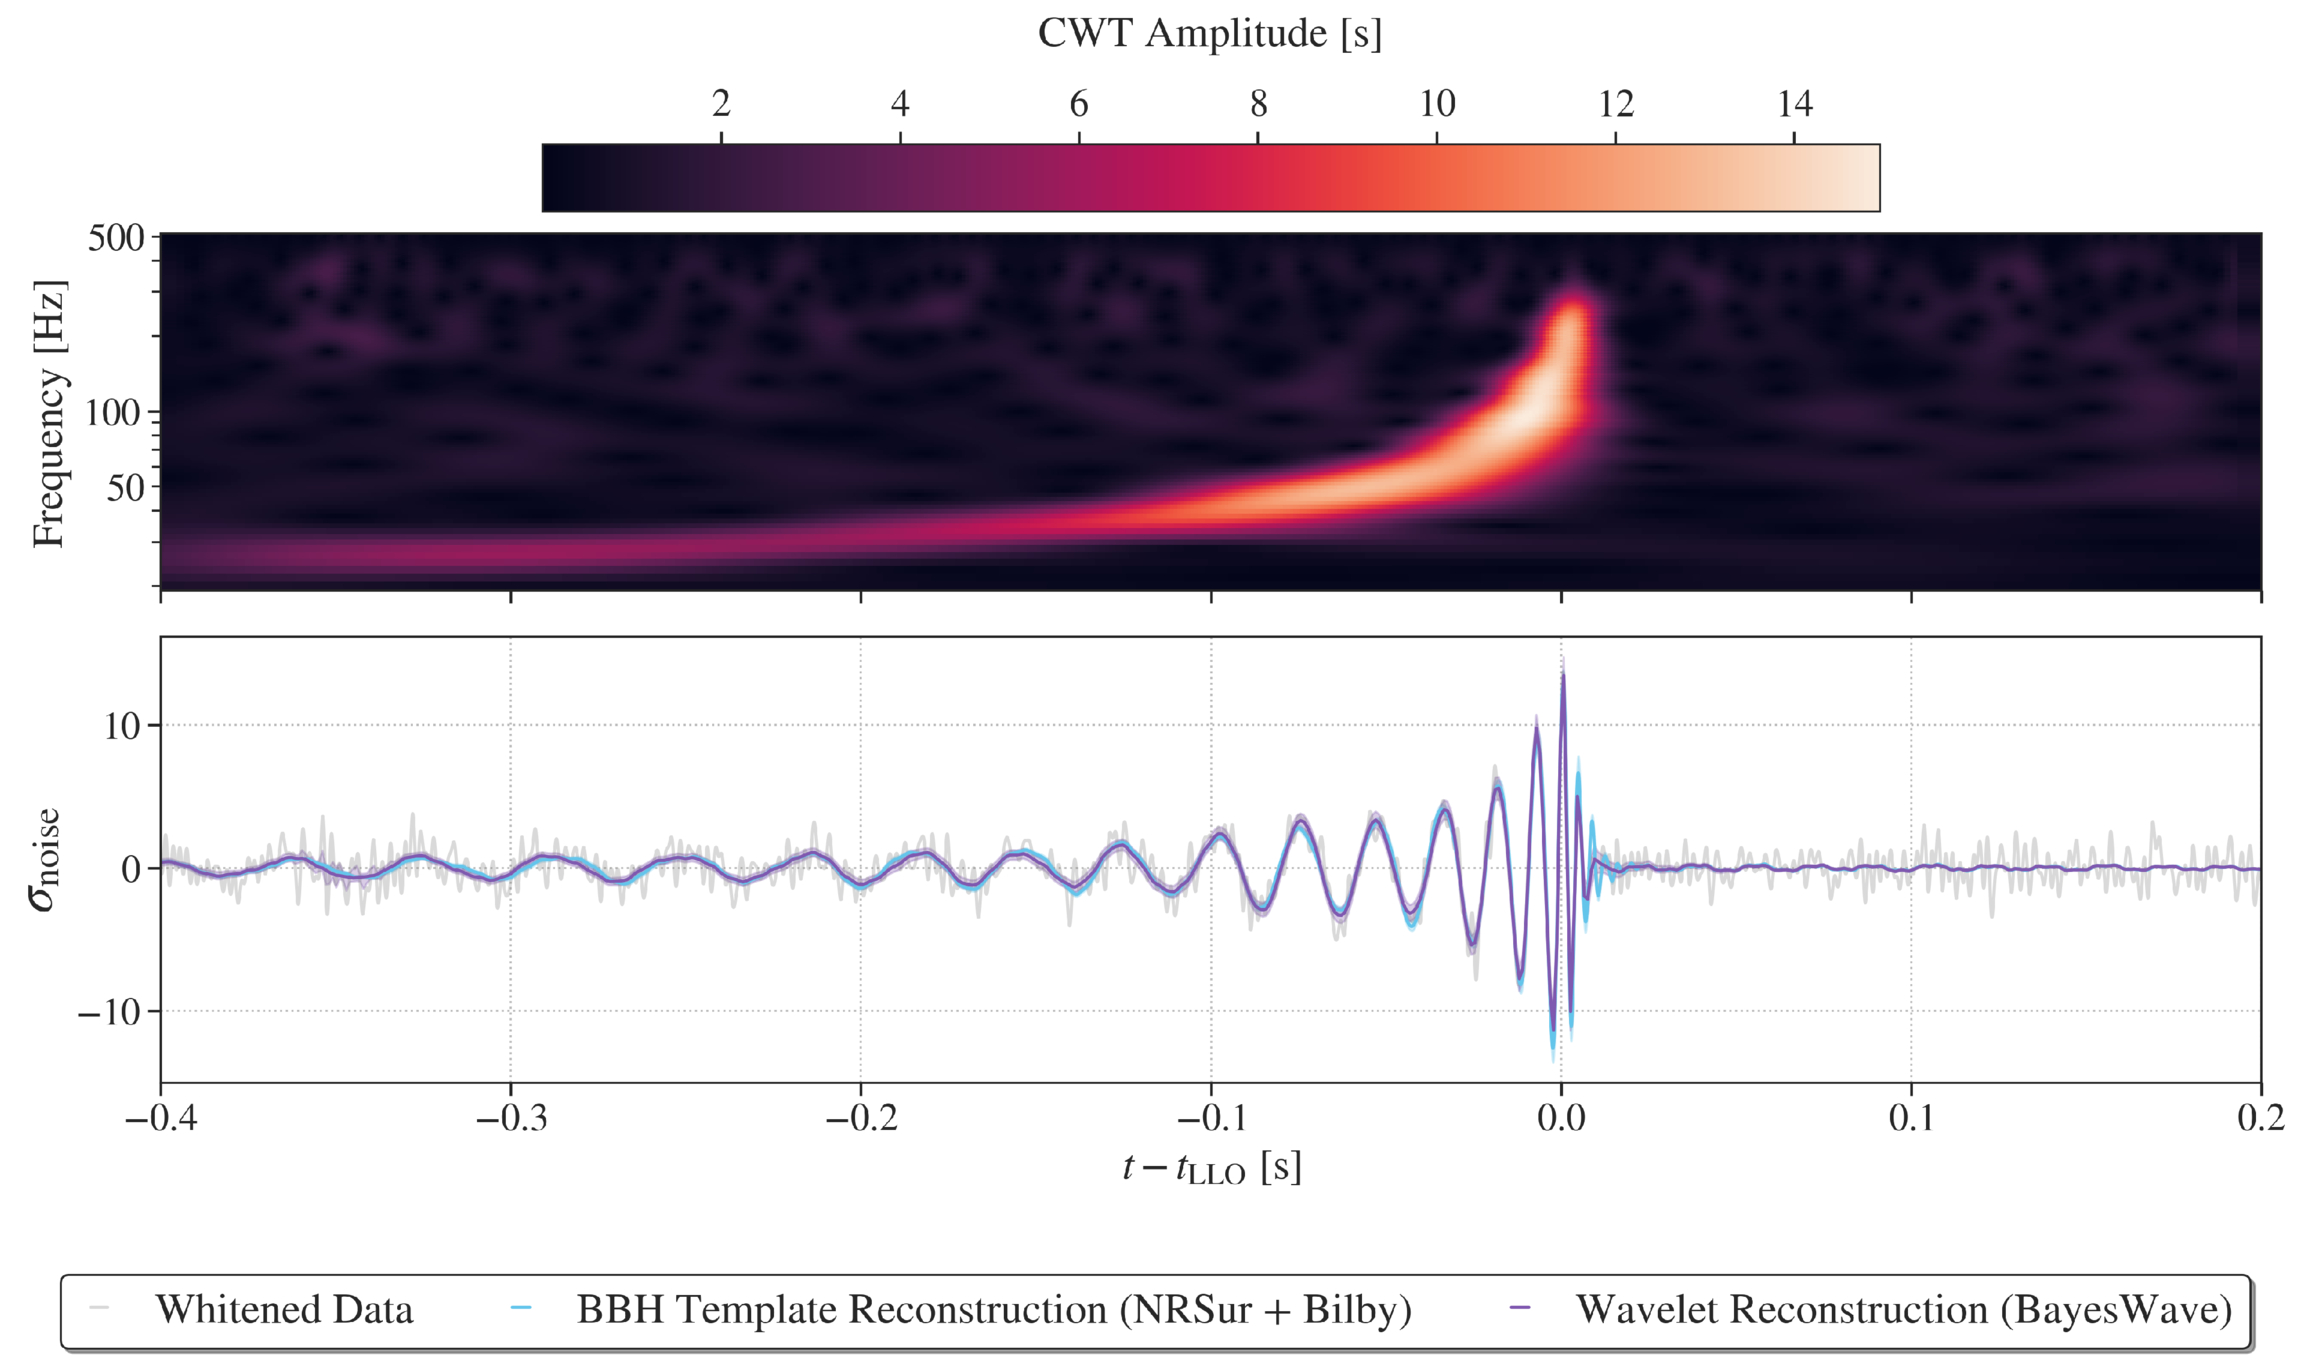
Representations of the GW230814 gravitational wave signal. Click to enlarge. [LVK Collaboration 2026]

GW230814, which was detected only by LIGO Livingston, is the loudest signal in the catalog. This signal is consistent with the collision of two black holes, each of roughly 30 solar masses. During the analysis of this signal, the team discovered potential deviations from the predictions of general relativity in the ringdown phase, when the remnant black hole settles into its final shape. Without a detection from another facility to corroborate this finding, it’s difficult to pinpoint the cause of the deviation, but the team could not rule out statistical noise fluctuations as the source.
Plot of the differential merger rate

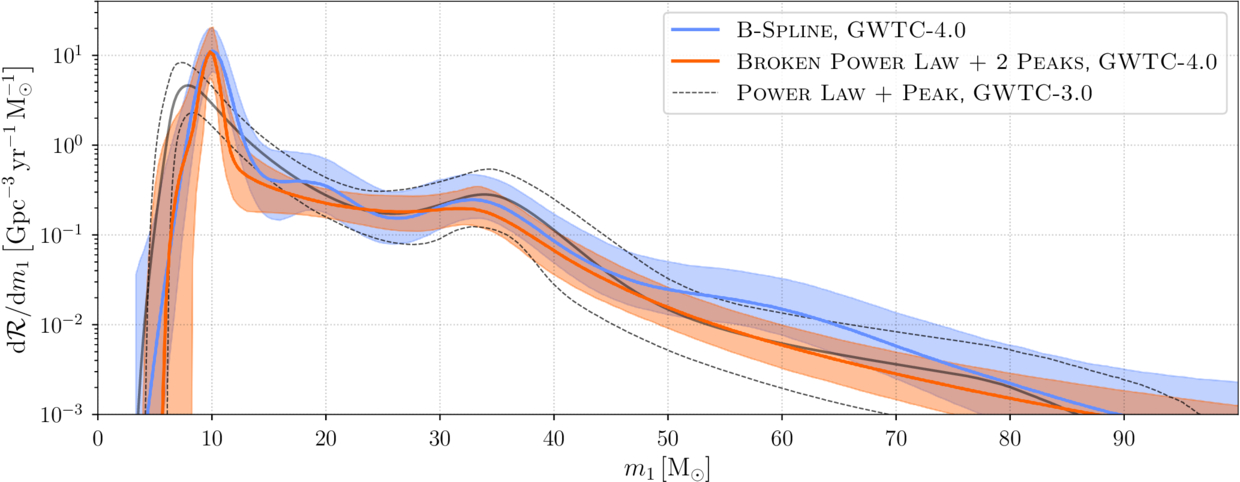
Plot of the differential merger rate as a function of the mass of the more massive of the two merger components. This shows overdensities at 10, 35, and possibly 20 solar masses. Click to enlarge. [LVK Collaboration 2026]

Surveying merging black holes and neutron stars on the population level, the team analyzed 158 gravitational wave signals from the current catalog. This analysis supported findings from previous transient catalogs, including multiple overdensities in the distribution of merging black hole masses, broadly distributed neutron star masses, and an increase in the merger rate with redshift. The new data strengthened certain previously identified trends, such as an increase in the width of the effective spin distribution with redshift, and weakened others.

The full list of articles in the GWTC-4.0 Focus Issue can be found here.

Citation

“GWTC-4.0: An Introduction to Version 4.0 of the Gravitational-Wave Transient Catalog,” A. G. Abac et al 2025 ApJL 995 L18. doi:10.3847/2041-8213/ae0c06

“GWTC-4.0: Methods for Identifying and Characterizing Gravitational-Wave Transients,” A. G. Abac et al 2026 ApJL 1004 L21. doi:10.3847/2041-8213/ae447b

“Open Data from LIGO, Virgo, and KAGRA Through the First Part of the Fourth Observing Run,” A. G. Abac et al 2026 ApJ 1004 232. doi:10.3847/1538-4357/ae211e

“GWTC-4.0: Updating the Gravitational-Wave Transient Catalog with Observations from the First Part of the Fourth LIGO–Virgo–KAGRA Observing Run,” A. G. Abac et al 2026 ApJL 1004 L22. doi:10.3847/2041-8213/ae2c74

“GW231123: A Binary Black Hole Merger with Total Mass 190–265 M⊙,” A. G. Abac et al 2025 ApJL993 L25. doi:10.3847/2041-8213/ae0c9c

“GW230814: Investigation of a Loud Gravitational-Wave Signal Observed with a Single Detector,” A. G. Abac et al 2026 ApJL 1004 L23. doi:10.3847/2041-8213/ae2ad3

“GWTC-4.0: Population Properties of Merging Compact Binaries,” A. G. Abac et al 2026 ApJL 1005 L51. doi:10.3847/2041-8213/ae771e

The post Monthly Roundup: The Fourth Catalog of Gravitational Wave Events from LIGO, Virgo, and KAGRA appeared first on AAS Nova.

The “Rhythm” of the Interstellar Medium

28 July 2026 at 17:00

Messier 17

Editor’s Note: Astrobites is a graduate-student-run organization that digests astrophysical literature for undergraduate students. As part of the partnership between the AAS and astrobites, we occasionally repost astrobites content here at AAS Nova. We hope you enjoy this post from astrobites; the original can be viewed at astrobites.org.

Title: The Rhythm of the ISM: Tracing the Timescales of Gas Evolution and Star Formation Across Galactic Environments
Authors: Zuzanna Kocjan and Vadim A. Semenov
First Author’s Institution: University of Maryland
Status: Published in ApJ

The Connection Between Gas and Star Formation in Galaxies

Stars are born in the interstellar medium (ISM) when cold, dense clouds of gas become unstable and collapse under gravity. Despite their plentiful reservoirs of gas, galaxies convert only a small fraction of this material into stars, making star formation a surprisingly inefficient process. A key factor behind this inefficiency is stellar feedback: radiation, stellar winds, and supernova explosions from young stars can inject energy and momentum into the surrounding gas, heating, stirring, and dispersing it. In this way, stellar feedback shapes future star formation across scales ranging from individual regions in the ISM to whole galaxies.

An important tool astronomers use to study star formation is the Kennicutt–Schmidt relation, which links the amount of gas in a galaxy to the rate at which stars form. More specifically, it relates the gas surface density, Σgas, to the star formation rate surface density, ΣSFR. (For more on this relation, see this Astrobites article on a classic research article.) However, this law is underpinned by a crucial ingredient: timescales. In particular, the pace of star formation depends both on how quickly galactic gas is cycled into star-forming material and on how rapidly those regions convert gas into stars once they form. Today’s article investigates the physical origin of star-formation scaling relations behind the Kennicutt–Schmidt law by building on a simple theoretical framework for the ISM.

Consider a Kettle of Boiling Water…

In a given region of a galaxy, the ISM consists of gas in either an actively star-forming state or an inert, non-star-forming state, depending on whether it is dense and unstable enough to collapse (as illustrated in Figure 1). The transition of non-star-forming gas into the star-forming state occurs on the supply timescale, τ+. Conversely, the dispersal of star-forming gas back into a non-star-forming state is characterized by the removal timescale, τ–. As a helpful analogy, the authors compare this process to water boiling in a kettle: the ISM is continuously “boiling,” with gas moving between active and inactive states. Meanwhile, the total gas reservoir gradually decreases, analogous to water slowly evaporating as the kettle boils. The gas depletion time, τ*, therefore represents the timescale over which the available gas would be exhausted by star formation.

Schematic of the gas cycling framework

Figure 1: Schematic of the gas cycling framework used in the authors’ theoretical model for how gas is converted into stars, which takes into account a supply, removal, and depletion timescale. [Adapted from Kocjan and Semenov 2026]

Building on this picture of gas cycling, the authors turn to simulated galaxies, where the motion and evolution of the gas can be followed directly. By tracking how gas flows through the ISM in the simulations, they derive the three characteristic timescales above — τ+, τ–, and τ* — that describe how gas is supplied to, removed from, and ultimately consumed by star formation. The goal is to connect the small-scale physics of the ISM to the large-scale star formation efficiencies and scaling relations observed across galaxies.

The Timescales of the Interstellar Medium

To explore how gas and star formation are connected across different galactic environments, the authors analyze three simulated systems: a dwarf galaxy, a Milky Way–like galaxy, and a gas-rich starburst galaxy, as shown in Figure 2. Despite spanning very different physical regimes, the galaxies exhibit remarkably similar trends in the fraction of gas actively forming stars as a function of Σgas​. This suggests that the amount of star-forming gas is governed primarily by local interstellar conditions, since regions with higher gas surface densities tend to contain denser, more strongly self-gravitating gas.

galaxy simulations and star-forming gas fraction

Figure 2: Using simulations (left to right) of an isolated intermediate-mass dwarf galaxy, Milky Way–like galaxy, and gas-rich galaxy, the authors measure the star-forming gas fraction versus the gas surface density (right). [Adapted from Kocjan and Semenov 2026]

To further understand this trend, this study then applies the authors’ theoretical framework to determine the timescales of ISM gas cycling on the scales of individual star-forming regions. These include the timescales for the formation, dispersal, and local depletion of star-forming gas as described above: τ+, τ−, and τ∗, which also exhibit strong correlations with the gas surface density (see Figure 3). Specifically, the timescale for supplying gas into the star-forming state is linked to the rate at which turbulence redistributes material through the galactic disk. The depletion timescale, over which star-forming gas is turned into stars, decreases at higher Σgas​, since denser regions more efficiently collapse and form stars. By contrast, the removal timescale is comparatively short, reflecting how quickly feedback and changes in local equilibrium can disrupt star-forming clouds. In this way, the “boiling kettle” framework is able to capture the major processes driving small-scale gas evolution.
Scaling relations between the supply, depletion, and removal times

Figure 3: Scaling relations between the supply (left), depletion (middle), and removal (right) times in kiloparsec-scale regions of the simulated galaxies (shown in different colors). Based on the measurements from the simulations, the authors introduce a parameterized model for the gas cycling framework, as defined in the equations. [Adapted from Kocjan and Semenov 2026]

The cycling of gas through different phases of the ISM offers a useful framework for understanding how galaxies form stars. In the relatively well-ordered systems studied here, this balance can be described in simple terms; however, it is likely to become more complex in extreme environments where additional physical processes — such as those operating in the early stages of galaxy formation — play a significant role. Even so, these results highlight how key galactic properties can emerge naturally from the interplay between galaxy-scale dynamics, ISM turbulence, and the state of star-forming gas.

Original astrobite edited by Jayde Willingham.

About the author, Shalini Kurinchi-Vendhan:

After studying astrophysics and literature at Caltech, I moved onto a Fulbright Fellowship in Heidelberg, Germany. I’m passionate about using computer simulations to explore supermassive black holes and galaxy evolution — but I also love poetry and traveling.

The post The “Rhythm” of the Interstellar Medium appeared first on AAS Nova.

First-Generation Stars Provide Better Fit than a Black Hole for Early-Universe Gas Clump

27 July 2026 at 17:00

Star formation in the early universe.

An unusual clump of gas 450 million years after the Big Bang may contain stars hailing from the universe’s elusive first generation of stars. New research examines an alternative explanation involving an accreting black hole.

Meet Hebe

Hebe and GN-z11

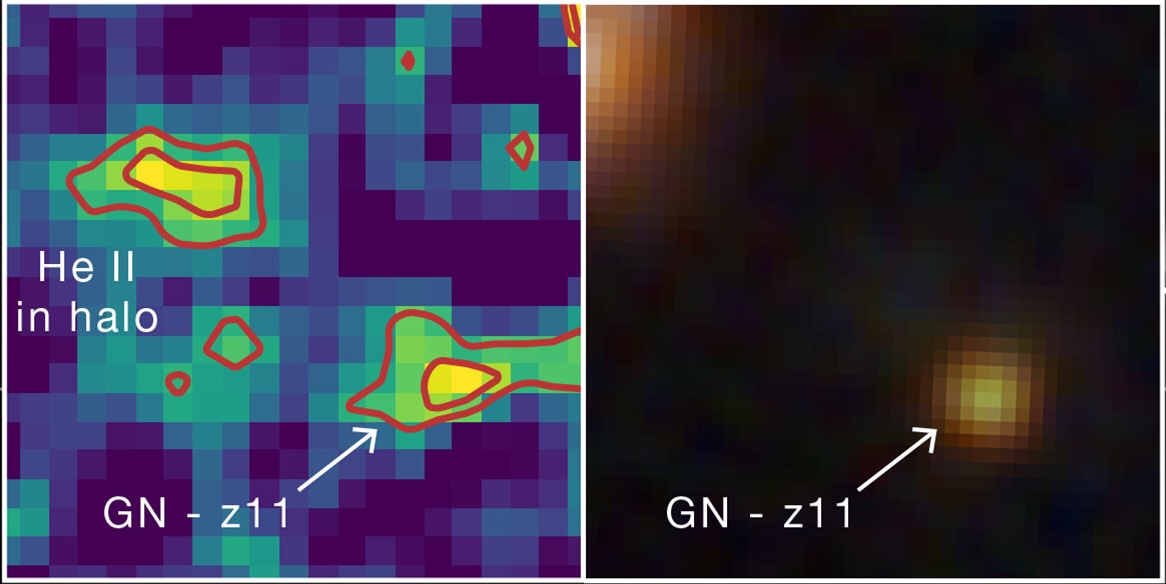
Hebe is visible in the image on the left as a prominent blob of helium emission up and to the left from GN-z11, a luminous galaxy hosting an accreting supermassive black hole. On the right is an infrared image of the same region, in which Hebe is not visible. Click to enlarge. [Adapted from NASA, ESA, CSA, Ralf Crawford (STScI)]

Initially spotted in 2024, an early-universe gas clump nicknamed Hebe has now been identified as a possible hiding place of Population III (Pop III) stars — the universe’s first generation of stars. Pop III stars are thought to be massive and chemically pristine, containing only hydrogen, helium, and a whisper of lithium. This exciting hypothesis was prompted by the detection of recombination lines from helium, which could be ionized by the high-energy radiation of the first stars.

Before the community settles on this exciting explanation, however, the hypothesis must withstand all the tests astronomers can throw at it. In a recent research article, Junehyoung Jeon, Tae Bong Jeong, and Saiyang Zhang (The University of Texas at Austin) along with Volker Bromm (The University of Texas at Austin) attempted to explain Hebe’s properties in another way.

Considering Alternatives

Hebe glows with distinctive helium emission that requires a source of high-energy radiation. This radiation could be provided by a cluster of Pop III stars, but it could also, in theory, arise from an accreting supermassive black hole embedded within the gas clump.

predicted Pop III star mass in Hebe

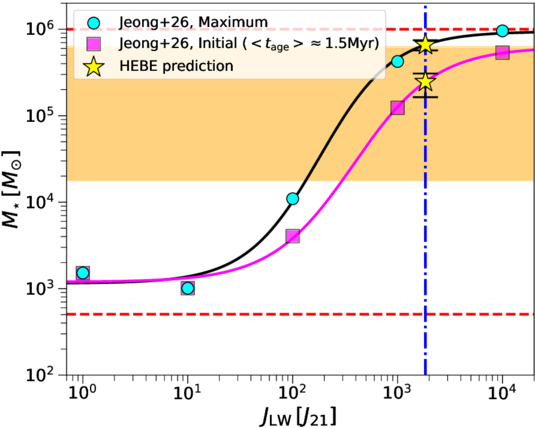
Predicted total mass of Hebe’s Pop III stars as a function of the Lyman–Werner flux from the nearby galaxy GN-z11. Click to enlarge. [Jeon et al. 2026]

The authors used models to explore both possibilities. For the first scenario, in which the telltale helium emission is driven by a cluster of Pop III stars, the team calculated the maximum possible mass of the cluster, which sets how much high-energy radiation is produced. The cluster mass is moderated by high-energy radiation from another source: GN-z11, a starburst galaxy situated about 10,000 light-years from Hebe. For the second scenario, the team modeled the spectral energy distribution arising from a supermassive black hole — either a direct-collapse black hole or a primordial black hole — accreting pristine gas from the surrounding cloud.

Still a Leading Explanation

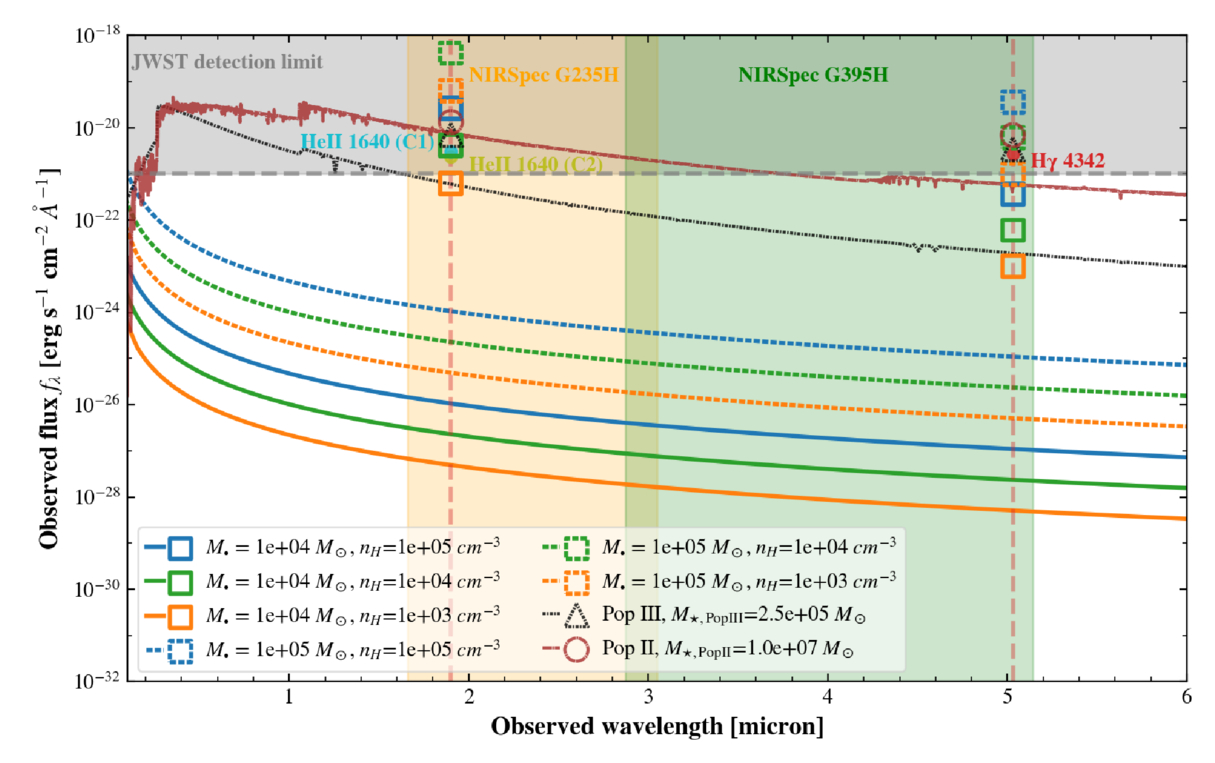
While the black hole scenario could, with reasonable black hole masses, gas densities, and accretion rates, reproduce individual flux measurements drawn from JWST observations, this hypothesis struggled to simultaneously match multiple measurements. The Pop III star cluster scenario, with a cluster mass of a few hundred thousand solar masses, provided the best fit to the JWST data.

modeled spectral energy distributions for Hebe based on the black hole or Pop III star hypotheses

Modeled spectral energy distributions (lines) and predicted line flux densities (open symbols) for the accreting black hole, Pop III star, and Pop II (second-generation) star hypotheses. The observed JWST line fluxes are shown as filled circles. Click to enlarge. [Jeon et al. 2026]

As a final test, the team introduced a third possibility involving a population of second-generation stars, which are more chemically enriched than Pop III stars. While this model fit well, the number of stars necessary to match the data — roughly 10 million — would produce a stellar continuum detectable (but so far not seen) by JWST.

While a cluster of Pop III stars is still the leading explanation for Hebe’s properties, the team noted that the Pop III star and black hole hypotheses aren’t mutually exclusive; Hebe could very well harbor a primordial black hole and a smattering of Pop III stars. Regardless of what powers its characteristic helium emission, Hebe offers an enticing glimpse into the early universe, and more work is needed to understand this intriguing object.

Citation

“What Is Powering the Enigmatic He II Emitter Hebe: The First Stars or Black Holes?” Junehyoung Jeon et al 2026 ApJ 1006 27. doi:10.3847/1538-4357/ae7bea

The post First-Generation Stars Provide Better Fit than a Black Hole for Early-Universe Gas Clump appeared first on AAS Nova.

❌