❌

Normal view

Democracy Has a Math Problem No Country Can Fully Solve

8 August 2026 at 23:08
Colorful Abacus Math CalculationsMathematics shows that every electoral system must compromise among proportionality, local representation, and parliament size. Denmark’s 2022 national election came down to a single seat, even though its proportional voting system was designed to make party representation closely match the vote. That outcome points to a deeper mathematical problem: no electoral system can always preserve [...]

U.S. Producer Price Index (PPI) drops in June, signaling easing inflation pressures

15 July 2026 at 15:00

U.S. Producer Price Index (PPI) drops in June, signaling easing inflation pressures

The U.S. Bureau of Labor Statistics (BLS) released its Producer Price Index (PPI) data for June 2026 today, showing a 0.3% decline in the index for final demand on a seasonally adjusted basis. This marks a reversal from the 0.6% rise in May and the stronger 1.1% increase in April. U.S. inflation is coming down.

On a year-over-year basis, producer prices rose 5.5% through June, down from the recent peak of 6.5% in May. This moderation comes amid cooling energy prices and could provide some relief to businesses and consumers facing persistent inflationary pressures.

Key Breakdowns from the June Report

• Goods prices led the decline, falling 1.4% in June — the largest drop since July 2022. Energy prices plunged 6.4%, with gasoline down 12.0%, diesel fuel, jet fuel, and crude petroleum also posting notable decreases.

• Food prices for final demand edged down 0.6%.

• Goods less foods and energy (a core measure) actually rose modestly by 0.2%.

• Services prices increased 0.2%, supported by gains in trade services margins (up 0.4%), including a sharp 13.0% jump in fuels and lubricants retailing. Transportation and warehousing services dipped slightly by 0.1%.

The index for final demand less foods, energy, and trade services — often watched as a core gauge — rose just 0.1% in June after a stronger 0.8% gain in May. Year-over-year, this core measure increased 5.1%.

What’s Driving the Decline?

The drop aligns with falling global oil prices in recent weeks, which have rippled through the supply chain. Energy categories, which had fueled earlier PPI gains (notably from Middle East tensions boosting costs earlier in the year), reversed course. This pullback in wholesale prices could eventually feed into lower consumer prices in the coming months, though services inflation remains sticky.

Implications for the Federal Reserve and Markets

This softer-than-expected PPI reading arrives on the same day as other inflation data and comes as the Fed monitors progress toward its 2% target. While headline producer inflation has cooled from its recent highs, the year-over-year figure remains elevated compared to pre-pandemic norms. Policymakers will likely view the energy-driven decline positively, but persistent services and core pressures suggest caution on rate cuts.

For businesses, lower input costs (especially energy) could help margins. Consumers may see relief at the pump and eventually in goods prices, though everyday services like healthcare, housing-related costs, and certain retail margins continue to trend upward.

Looking Ahead

The June PPI data suggests inflation is not accelerating, but the path to sustainably lower levels remains uneven. Markets will now turn to upcoming CPI releases and other indicators for a fuller picture. Keep an eye on energy markets — any rebound in oil prices could quickly reverse these gains.

Combined with yesterday’s CPI data decline (see below), the PPI data supports a story of disinflation under the Trump administration. This is likely helpful to Republicans heading into the midterm elections, as voters generally reward perceived economic competence.

U.S. CPI data (July 14, 2026) showed a notable decline:

• Monthly change: -0.4% (biggest monthly drop since April 2020)
• Annual inflation rate: 3.5% (down from 4.2% in May)
• Core CPI (excluding food & energy): Unchanged (0.0%) in June, down from +0.2% in May
• Core annual rate: 2.6% (down from 2.9% in May)

This is net positive for Apple’s long-term outlook. Tech giants like Apple tend to be among the biggest winners when inflation cools enough for the Fed to cut rates without triggering a recession. Wall Street will likely view this data favorably for growth stocks like AAPL.

MacDailyNews Note: Data sourced from the U.S. Bureau of Labor Statistics Producer Price Indexes release for June 2026. All figures are seasonally adjusted unless noted.


‎
Please help support MacDailyNews — and enjoy subscriber-only articles, comments, chat, and more — by subscribing to our Substack: macdailynews.substack.com. Thank you!

Support MacDailyNews at no extra cost to you by using this link to shop at Amazon.

The post U.S. Producer Price Index (PPI) drops in June, signaling easing inflation pressures appeared first on MacDailyNews.

Culturally Tailored Maternity Care Boosts First Nations Birth Health

9 July 2026 at 06:00

A recent groundbreaking study published in The Lancet’s eClinical Medicine reveals that a culturally tailored continuity of midwifery care model significantly improves perinatal outcomes for First Nations families in Victoria, Australia. This innovative approach, known as the Baggarrook Yurrongi or “Women’s Journey” model, ensures that women expecting First Nations babies receive consistent care from a known midwife throughout pregnancy, birth, and the early postnatal period.

Developed collaboratively with First Nations health organizations and maternity services, the Baggarrook Yurrongi model addresses the unique cultural needs of Aboriginal and Torres Strait Islander families. The study analyzed over 164,000 births from three major hospitals, including outcomes for more than 2,000 First Nations babies. Researchers utilized a prospective, non-randomized design, comparing data before (2012–2017) and after (2017–2022) the model’s implementation to assess its real-world efficacy.

The findings demonstrated monumental improvements: there was a 45% increase in the rate of healthy births among First Nations babies. Additionally, the likelihood of low birthweight decreased by 33%, preterm births by 36%, and neonatal intensive care admissions by 30%. Mothers were also 86% more likely to initiate breastfeeding, underscoring enhanced postnatal engagement and infant health support.

Lead researcher Professor Della Forster emphasized the significance of culturally informed midwifery continuity care, highlighting its role in bridging healthcare disparities. By fostering trust and cultural safety, the model encourages better health practices and outcomes, marking a notable stride toward closing the persistent gap in Indigenous perinatal health.

Key to the success of this approach is the trusted relationship a known midwife builds with expectant mothers—crucial for communities historically wary of healthcare systems. Programs like Mercy Hospital for Women’s Nangnak Baban Murrup and Joan Kirner Women’s and Children’s Hospital’s Galinjera have demonstrated both high uptake and satisfaction levels among clients and midwives alike, indicating sustainable integration into standard maternity care.

Clinical Midwife Specialist Evelyn Burns remarked that this continuity of care model profoundly impacts women’s confidence and connection during pregnancy. The study’s robust dataset and positive qualitative feedback from both families and clinicians provide compelling evidence for broader adoption across Australian maternity services.

This research not only validates the efficacy of culturally tailored care models but advocates for their expansion nationwide to ensure equitable and effective maternity healthcare for all First Nations families. The findings represent a pivotal shift in perinatal care paradigms, blending cultural competence with clinical excellence to improve long-term maternal and infant health outcomes.


Subject of Research: People
Article Title: The effect of culturally tailored continuity of midwifery care on perinatal outcomes for women having a first Nations baby in Victoria, Australia: a prospective non-randomised translational study
News Publication Date: 24-Jun-2026
Web References: https://www.thelancet.com/journals/eclinm/article/PIIS2589-5370(26)00281-6/fulltext
References: 10.1016/j.eclinm.2026.104028
Image Credits: La Trobe University
Keywords: Health care, First Nations, midwifery continuity, perinatal outcomes, culturally tailored care

Majority of Kidney Transplant Candidates Never Make It to the Waitlist

20 June 2026 at 22:29

Nearly half of American patients diagnosed with kidney failure face a significant hurdle that remains largely unnoticed: the daunting path from referral for kidney transplantation to actually being listed as a transplant candidate. A groundbreaking national study spearheaded by researchers from NYU Langone Health reveals that only about 19 percent of these patients complete the rigorous evaluation process required to join the kidney transplant waitlist. Alarmingly, nearly 48 percent never even commence this critical phase, underscoring a systemic challenge within transplant medicine that urgently warrants comprehensive attention.

Kidney transplantation is widely regarded as the optimal treatment for end-stage renal disease, significantly enhancing both survival rates and quality of life over long-term dialysis. Despite extensive research focusing on outcomes and management once patients are waitlisted or transplanted, the early stages—particularly the transition from referral to evaluation—have remained remarkably underexplored. The new study addresses this knowledge gap by meticulously analyzing data that track patient progression (or dropout) through each sequential step: referral, evaluation, waitlisting, and transplantation.

Leveraging the formidable Epic Cosmos database, which aggregates over 300 million electronic health records from more than 1,850 medical institutions—including over a third of all U.S. transplant centers—the research team was able to follow 720,348 adult patients referred for kidney transplantation between 2014 and 2025. By applying advanced statistical modeling, the researchers dissected how variables such as demographic factors, socioeconomic status, geographic location, and medical complexities influence patient trajectories through the transplant pipeline.

One of the study’s most compelling revelations is the multifaceted nature of barriers patients face long before they arrive on the transplant waitlist. Particularly vulnerable are unmarried individuals, those categorized with severe obesity, and patients residing in rural areas. These groups demonstrated disproportionately lower rates of starting and completing the transplant evaluation. The researchers suggest that limited social support, compounded by logistical challenges in accessing transplant centers mostly concentrated in urban settings, profoundly affects these disparities.

Language barriers and poverty add further layers of complexity. Older patients, Spanish speakers, and economically disadvantaged populations exhibited reduced odds of progressing beyond referral. The evaluation process itself, demanding repeated visits for comprehensive testing—including hematologic assays, radiologic imaging like chest X-rays, and oncologic screenings—can extend over months. This prolonged and intricate schedule poses significant strain on patients, particularly those simultaneously managing frequent dialysis treatments.

Institutional factors also shape patient outcomes. Smaller transplant centers, often with constrained resources and fewer transplant slots, tend to adopt more conservative patient selection criteria. This resource scarcity may lead to heightened risk aversion, amplifying the likelihood that individuals are filtered out early in the process. In contrast, larger centers with expansive infrastructure appear better suited to support patients through the complex evaluation stages, enhancing access equity.

Beyond healthcare infrastructure, psychosocial elements emerge as crucial determinants. The study highlights the importance of marital status and social support networks, which facilitate navigating the exhaustive appointment schedule and the psychological burden of chronic illness management. Candidates lacking robust social backings are more susceptible to discontinuing the transplant workup, emphasizing that transplant candidacy extends beyond physiological suitability to encompass holistic patient contexts.

The authors underscore that the transplant evaluation pathway remains one of the most intricate and strenuous journeys in medical care, entailing multifaceted specialist consultations, laboratory testing, and patient education. Each phase demands adequate patient understanding, resource availability, and logistical feasibility, accentuating the necessity for patient-centered strategies to democratize access.

Conor Donnelly, MD, the study’s lead author and PhD candidate at NYU Grossman School of Medicine, reflects on the striking influence of non-medical factors, stating the interplay of geography, healthcare center characteristics, and social environment decisively shapes transplant waitlisting outcomes. He advocates for system-level reforms targeting these upstream barriers to broaden equitable transplant access.

Allan B. Massie, PhD, co-senior author, emphasizes the potential impact of tailored educational efforts and patient navigation services to demystify and streamline the evaluation process. By reducing administrative burden and fostering comprehensible pathways, health systems can meaningfully increase the number of patients transitioning from referral to active waitlisting.

Similarly, Michal A. Mankowski, PhD, co-senior author and assistant professor of surgery, notes this study paves the way for probing analogous barriers in other organ transplant domains, each characterized by distinct logistical and clinical considerations. Expanding this research is vital for holistic transplant equity improvements.

The research, published June 20, 2026, in the Journal of the American Society of Nephrology and presented at the American Transplant Congress, marks the most extensive analysis to date of the attrition points in the kidney transplant continuum. These insights hold profound implications for policy frameworks, patient advocacy, and healthcare delivery models.

Addressing the entrenched social and systemic impediments to kidney transplantation demands coordinated efforts involving healthcare providers, payers, policymakers, and community stakeholders. Streamlining referral and evaluation protocols, augmenting support services, and ensuring resource availability at smaller centers—particularly in underserved regions—stand as imperatives.

NYU Langone Health’s funding and multidisciplinary team underscore the critical priority of tackling kidney transplant disparities with data-driven precision and commitment, aspiring to ensure that the lifesaving promise of transplantation reaches every eligible patient without undue delay or discrimination.


Subject of Research: People
Article Title: Evaluating Barriers to Kidney Transplantation in the United States
News Publication Date: 20-Jun-2026
Keywords: Organ transplantation, Renal failure, Nephropathies, Health care delivery, Health disparity, Health equity

Study Finds ‘Red Flag Laws’ Associated with Lasting Decrease in Arrest Rates

16 June 2026 at 21:24

In a groundbreaking study published in PNAS Nexus on May 23, 2026, researchers have unveiled compelling evidence that extreme risk protection orders (ERPOs), frequently known as “red flag” laws, substantially diminish the likelihood of arrests among individuals subjected to these legal interventions. This decline in arrests encompasses a broad spectrum of offenses, notably violent crimes and firearm-related offenses, and persists not only during the enforcement period of the orders but intriguingly continues well beyond their expiration. These findings are poised to reshape public policy discussions concerning firearm violence prevention strategies in the United States.

The context driving this research is a nationwide crisis of firearm violence, which as of 2024, has tragically culminated in over 43,000 deaths, with shootings in 2025 alone injuring approximately 40,000 individuals, excluding cases of suicide. Such staggering figures underscore the urgent need for efficacious interventions. ERPOs have emerged as a targeted legal mechanism whereby courts temporarily restrict firearm access for individuals deemed to pose an imminent threat to themselves or others. Currently, 22 states, alongside the U.S. Virgin Islands and the District of Columbia, have enacted distinct ERPO statutes, reflecting growing legislative momentum. California pioneered this policy approach in 2016, branding them Gun Violence Restraining Orders.

The retrospective cohort study analyzed detailed arrest data from 679 California residents subject to ERPOs between 2016 and 2019. Demographic profiling revealed a predominance of males (91.9%) with an average age slightly above 40 years. Ethnically, the cohort comprised mainly White individuals (59.9%), followed by Hispanic (19%) and Black populations (10.3%). Researchers meticulously compared arrest rates across three critical intervals: six months preceding the ERPO issuance, during the active order period, and the subsequent six months following order expiry. The scope of offenses under scrutiny included any form of arrest, violent crime, firearm-related offenses, and firearm-specific violence.

Quantitative analysis revealed that the presence of an ERPO corresponded with an impressive 55% reduction in arrests for any offense compared to the baseline six-month period prior. Arrests specifically for violent crimes plummeted by 71%, while firearm-related arrests witnessed a striking 76% decline. Most notably, firearm violence arrests decreased by an extraordinary 80% during the enforcement phase. These statistics not only affirm ERPOs’ immediate efficacy in curtailing dangerous behaviors but also highlight their targeted protective potential.

Perhaps more unexpectedly, the data indicated that the downward trend in arrests did not revert to pre-order levels once ERPOs expired. Instead, reductions persisted and even deepened in certain categories. Post-expiration, arrest rates for any offense decreased by 63%, violent crime arrests by 75%, firearm-related offenses by 70%, and firearm violence arrests by 63%. Such sustained effects provoke critical questions about the mechanisms through which ERPOs might exert enduring behavioral influence, potentially functioning as a catalyst for long-term risk amelioration.

While the study’s outcomes exude optimism, authors elucidate several methodological limitations. Primary among these is the reliance on arrest records as a proxy for criminal activity, a metric subject to inherent biases and imperfect capture of all unlawful behavior. Additionally, the exclusive focus on California’s ERPO implementation during a specific timeframe limits the generalizability of findings to other jurisdictions or more current contexts. Nonetheless, the robust statistical associations discovered furnish key empirical support for ERPOs’ role in comprehensive violence reduction frameworks.

Veronica Pear, the study’s lead investigator and a respected epidemiologist affiliated with the UC Davis Centers for Violence Prevention, articulates the multipronged utility of ERPOs. “While often conceptualized primarily for suicide prevention, our analysis elucidates their significant function in preventing interpersonal violence,” Pear asserts. This research thus broadens the conceptual paradigm, reinforcing ERPOs as a practical, evidence-based intervention capable of mitigating acute crises and producing enduring safety benefits.

This study also complements a growing body of literature that underscores ERPOs as instrumental in suicide prevention, consolidating their standing as a versatile tool in public health and criminal justice spheres. The convergence of findings across domains of self-directed and other-directed violence lends vital credence to expanding ERPO adoption and refining enforcement protocols, especially given the current societal imperative to stem firearm-related morbidity and mortality.

From a policy perspective, these insights furnish lawmakers with empirically grounded justifications for instituting or strengthening ERPO frameworks. Importantly, the study encourages a nuanced appreciation of ERPOs’ temporal dynamics, highlighting the necessity for continued engagement and perhaps supplemental interventions after an order lapses to sustain positive outcomes.

On the frontier of violence prevention research, the study paves avenues for further investigation into optimizing ERPO implementation, exploring differential impacts across demographic subgroups, and elucidating the behavioral psychology underlying observed arrest reductions. Such endeavors will be pivotal in tailoring ERPO policies that maximize protective effects while respecting individual rights and legal safeguards.

As firearm violence continues to exact a heavy toll on American communities, this research provides a beacon of evidence-informed hope. By harnessing the nuanced potential of ERPOs, stakeholders can better navigate the complex interplay of legal, public health, and social factors driving violence prevention and move toward a safer society.

Subject of Research: People

Article Title: Reduced incidence of arrest following an extreme risk protection order among respondents in California

News Publication Date: 23-May-2026

Web References:

References:

  • Pear, V., et al. (2026). Reduced incidence of arrest following an extreme risk protection order among respondents in California. PNAS Nexus. DOI: 10.1093/pnasnexus/pgag184

Keywords: Gun violence, Public health, Crime, Criminology, Human social behavior

Cluster Before Stack: A New Algorithm for Pulsar Timing

19 September 2025 at 17:00

A photograph of a large radio dish taken during the day from above.

To measure properties of a pulsar accurately, astronomers have to stack many individual observations together to boost the signal above the noise. But what if there was a more clever, more effective way to add observations than simple stacking?

Weak Cosmic Lighthouses

Pulsars, or rapidly spinning neutron stars that emit narrow cones of radio waves, are often referred to as the galaxy’s lighthouses. Just like a sailor looking to shore might see a periodic flash when a lighthouse’s beacon sweeps over their ship, so too would radio telescopes aimed at a pulsar detect a “pulse” when its beam sweeps across Earth. However, although this comparison to lighthouses is a powerful analogy, it starts to break down when considering the speed and strength of these flashes.

A time series showing a Gaussian-like spike.

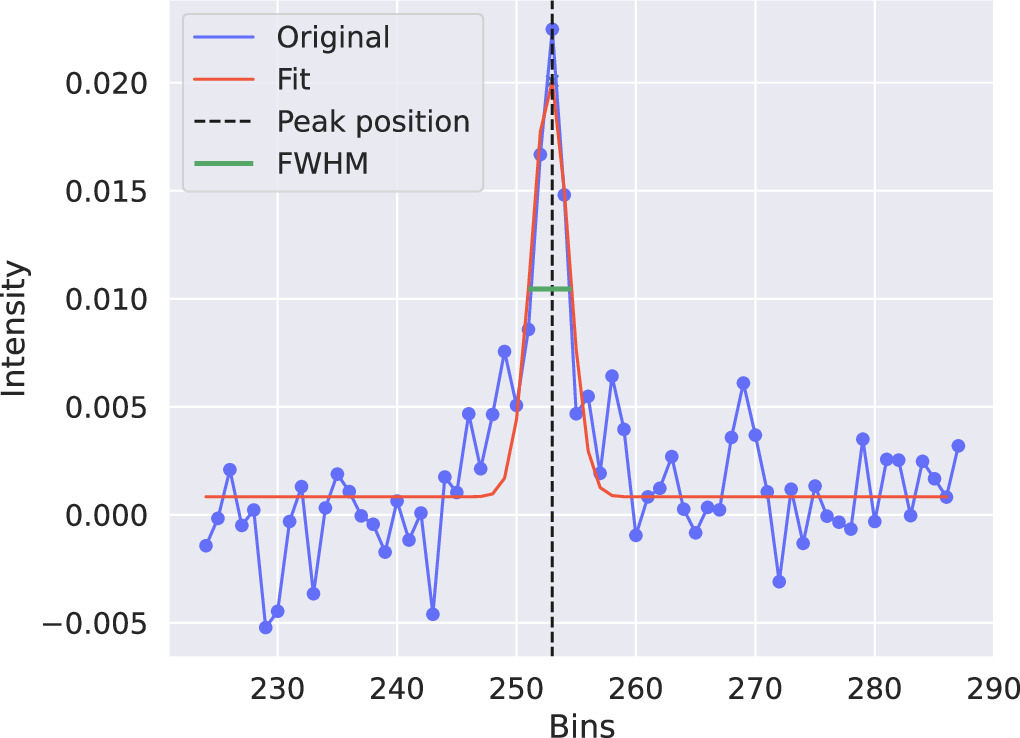
An example of one noisy individual pulse. Click to enlarge. [Sosa Fiscella et al. 2025]

While lighthouses may take several seconds to rotate their lens and lamp once around, pulsars do the same in just a few milliseconds. What’s more, while lighthouses are designed to be bright enough that sailors can notice every individual flash, pulsars are comparatively dim. To confidently measure the “pulse profile,” or how a pulsar’s radio intensity changes as a function of its rotation phase, astronomers need to stack those hundreds of thousands of pulses together into one artificial super-bright pulse. Only then can they measure the quantities they care about, like the precise spin period and average pulse arrival time.

This practice rests of the subtle assertion that every individual pulse is just a noisy variation of the same unchanging pulse profile. But is that safe to assume? And can we improve the precision of our measurements by doing something more complex than simple stacking? These are the questions recently tackled by a team of astronomers led by Sofia V. Sosa Fiscella (Rochester Institute of Technology) in research published in The Astrophysical Journal.

Squeezing the Data

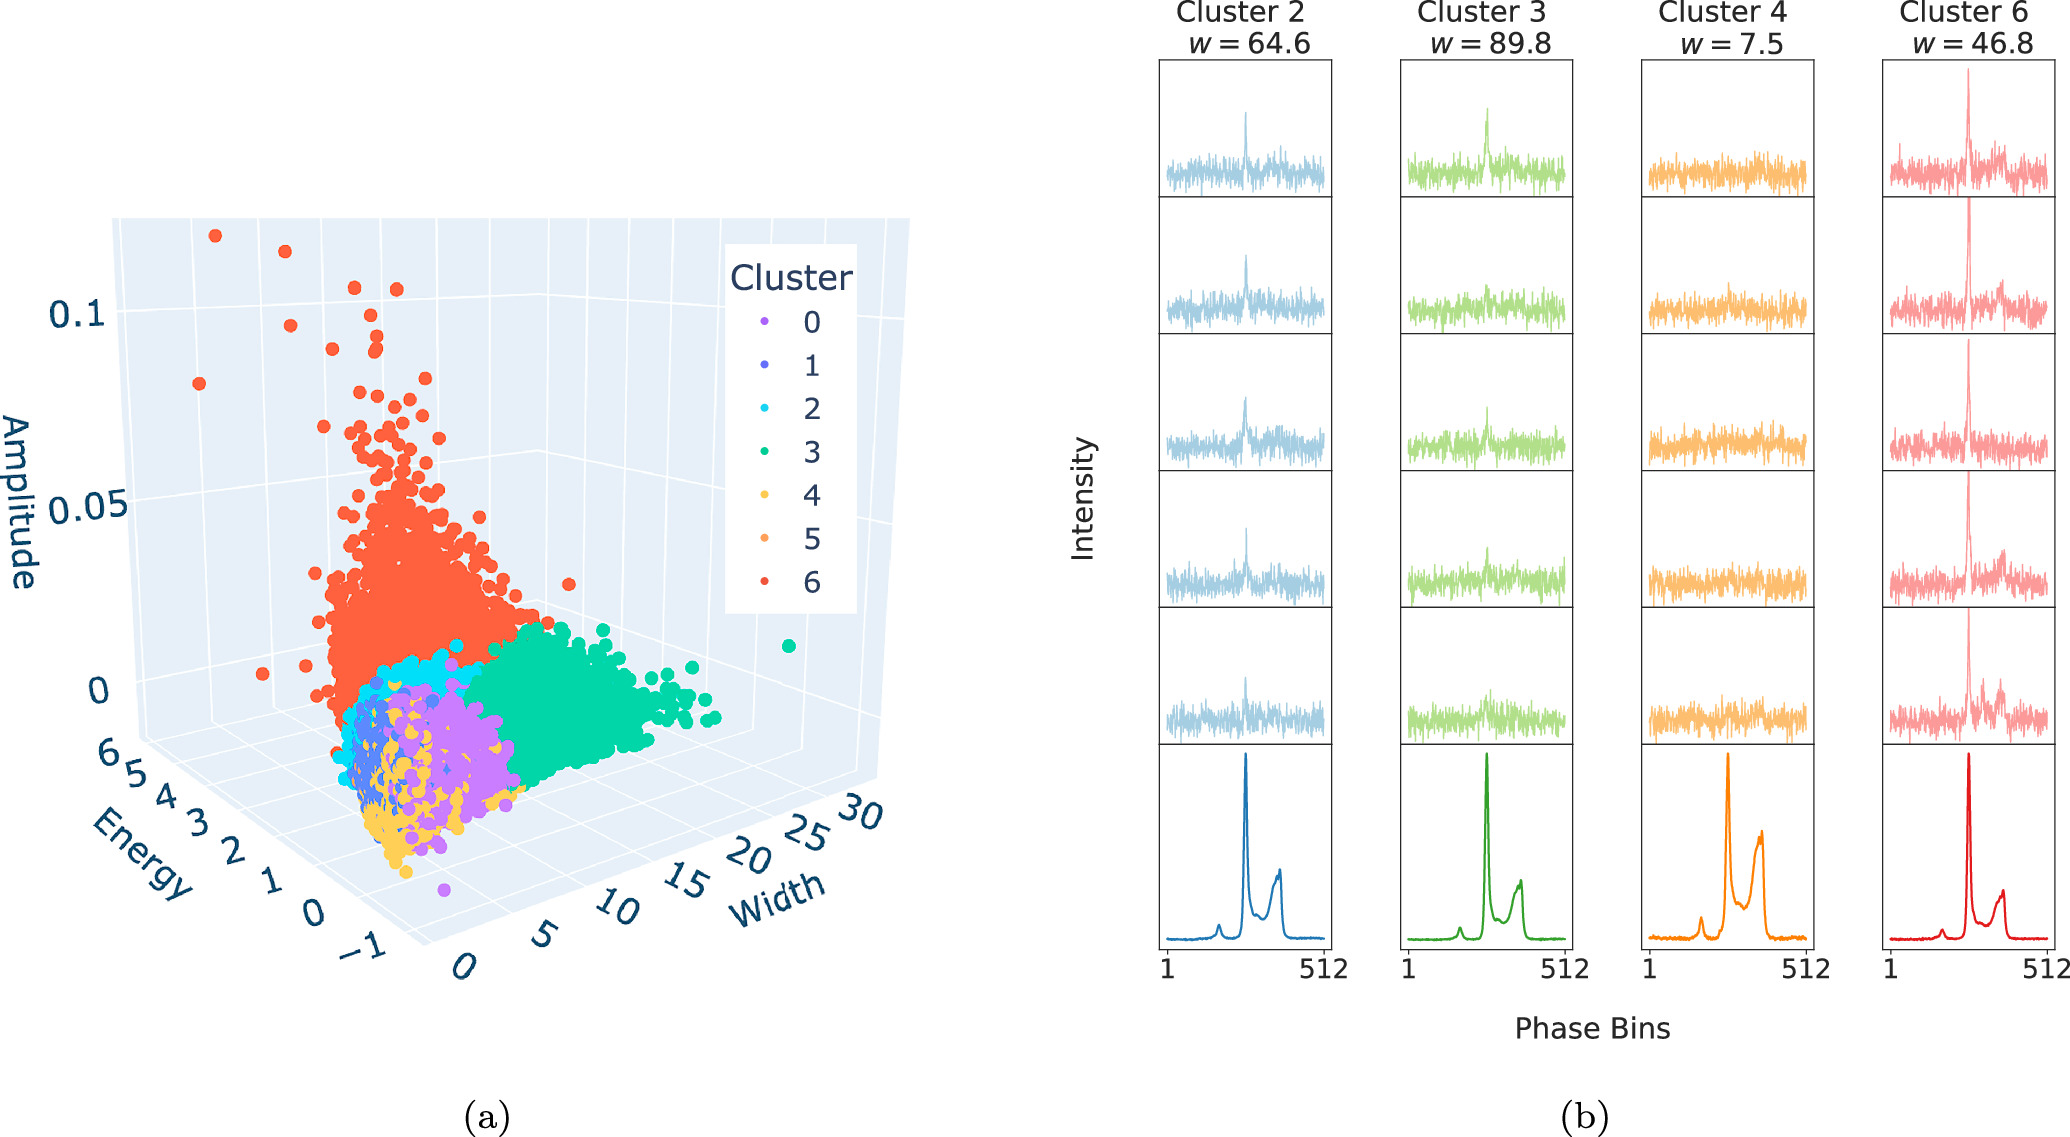
The researchers focused on one particularly bright source named PSR J2145−0750 that was observed by the Green Bank Telescope for two hours in 2017. This pulsar is so bright that it’s possible to measure quantities like the pulse width, height, center, and total energy of individual pulses, not just the final stack. The team did just that for each of the more than 200,000 pulses in their dataset and assigned each one a vector of four numbers. When they next sorted the pulses into distinct groups, they found that there were indeed correlations among these variables: for example, pulses with higher maximum heights tended to arrive earlier and be narrower than the overall average.

A 3D plot across different measured pulse characteristics where each point is colored according to its cluster.

A visual representation of the different pulse clusters. Each point corresponds to one pulse. Click to enlarge. [Sosa Fiscella et al. 2025]

To take advantage of this structure, they created a stacked pulse profile for each cluster, measured the center in each of them, then averaged all the cluster-specific times together into a final answer. While the standard method of stacking all of the data into one pulse profile resulted in a timing precision of 0.066 microsecond, this new method shrank the uncertainty to 0.057 microsecond, a meaningful improvement.

Though the team cautions that this new method will likely only be relevant for the pulsars for which we can measure individual pulses, they also point out that as better telescopes come online, we’ll be able to do that for more pulsars. In the meantime, astronomers can take comfort in the fact that as our technological abilities improve, so do our abilities to squeeze as much from our data as possible.

Citation

“Improving Pulsar Timing Precision with Single Pulse Fluence Clustering,” Sofia V. Sosa Fiscella et al 2025 ApJ 984 111. doi:10.3847/1538-4357/adc1c2

The post Cluster Before Stack: A New Algorithm for Pulsar Timing appeared first on AAS Nova.

Jumping Through Hoops: A New Way to Explore the Black Hole–Galaxy Connection

3 June 2025 at 17:00

composite image of the active galaxy Centaurus A

Editor’s Note: Astrobites is a graduate-student-run organization that digests astrophysical literature for undergraduate students. As part of the partnership between the AAS and astrobites, we occasionally repost astrobites content here at AAS Nova. We hope you enjoy this post from astrobites; the original can be viewed at astrobites.org.

Title: A Novel Approach to Understanding the Link Between Supermassive Black Holes and Host Galaxies
Authors: Gabriel Sasseville et al.
First Author’s Institutions: University of Montreal; Ciela—Montreal Institute for Astrophysical Data Analysis and Machine Learning; Center for Research in Astrophysics of Québec
Status: Published in ApJ

Most galaxies are thought to host a central supermassive black hole, and these black holes play a crucial role in shaping how galaxies evolve. There is a strong connection found between the properties of a galaxy and its central black hole. One of the most well-known examples is the relationship between the black hole’s mass and the random motions of stars near the galaxy’s center, measured by a quantity called stellar velocity dispersion (denoted as σ). This connection, known as the M–σ relationship, has been studied for decades and is often used to estimate the mass of a galaxy’s central black hole.

Interestingly, some galaxies appear to lack a central black hole. In many cases, observations only provide an upper limit on the possible mass of any black hole that might be there. In today’s article, the authors study the M–σ relationship with a new statistical approach to account for galaxies that might not have a central black hole and improve the calculation of this relationship.

Hurdle Up, the Bayesian Way

The authors use a statistical method called the Bayesian hurdle model. To update our understanding, Bayesian modeling combines prior beliefs or initial guesses with new evidence. The Bayesian hurdle model approach tackles two key questions: first, whether a galaxy is likely to host a central black hole, and second, if it does, how the black hole’s mass relates to the galaxy’s velocity dispersion (σ). The model works in two stages. In the first step, called the “hurdle,” a logistic regression determines the probability that a galaxy has a central black hole. If the galaxy clears this hurdle (i.e., is likely to host a black hole), the second step uses linear regression to establish the relationship between the black hole’s mass and the galaxy’s velocity dispersion, analyzed on a logarithmic scale.

The study examines a sample of 244 galaxies where either the central black hole mass has been measured directly or an upper limit has been estimated. From the logistic regression step, the authors find that galaxies with σ > 126 km/s have a 99% probability of hosting a central black hole. This result suggests that while massive galaxies are almost certain to have black holes, smaller dwarf galaxies are much less likely to host them.

A Steeper Correlation

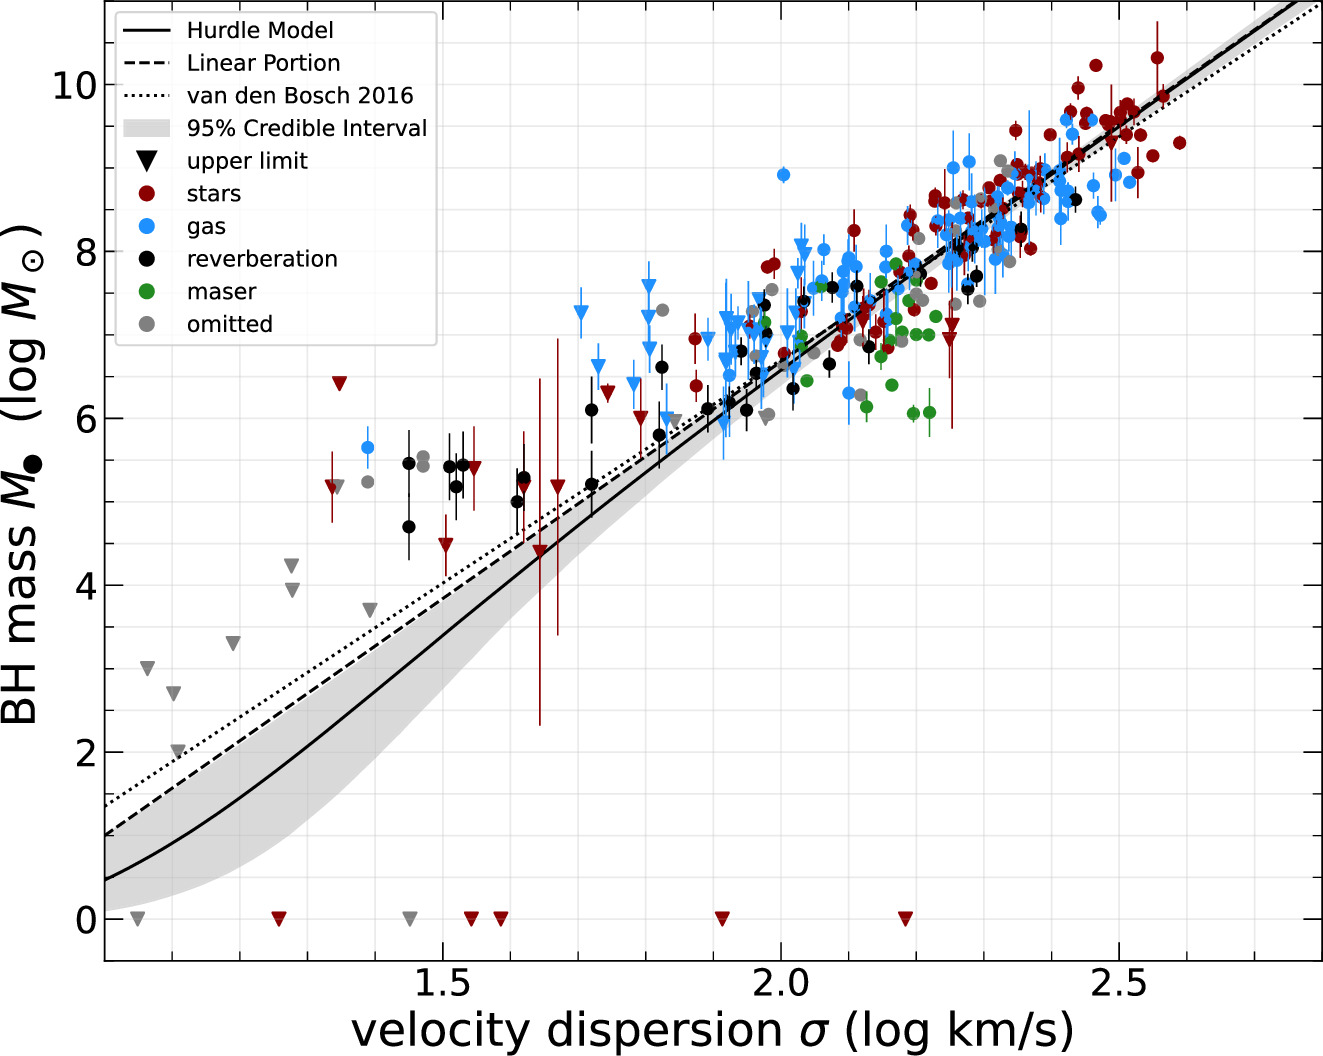
The hurdle model reveals a relationship of M ∝ σ5.8 between black hole mass and velocity dispersion, as shown in Figure 1 (solid black line). This result is steeper than the correlations found in previous studies. The difference likely arises from the authors’ inclusion of upper limits on black hole masses in their hurdle model analysis. The hurdle model also predicts several under-massive black holes in the range of 101–105 solar masses compared to other linear model studies. This downward shift in the lower mass range compared to other models is seen in Figure 1. Also, the breakpoint between under-massive and over-massive black holes occurs at a lower mass than previously reported. This shift is due to the hurdle model’s handling of upper limits in the logistic regression step, which pulls the curve downward.

plot of black hole mass versus velocity dispersion.

Figure 1: Relationship between the black hole mass and velocity dispersion (σ). The upper limits on the black hole masses are plotted in triangles while the circles indicate more precise measurements. The dotted black line shows the linear fit obtained in a previous study of this correlation. The hurdle model fit is shown as a solid black line while the dashed black line is the linear portion of the fit. Notice that the slope of the hurdle model fit (solid black line) is steeper than the fit from the previous study (dotted black line). [Sasseville et al. 2025]

The authors highlight that their model could benefit from better parameter estimates for the hurdle step, requiring further analysis of upper limits on black hole masses. They also recommend exploring alternative scaling relationships for calculating black hole masses. For example, the more well-established black hole mass–galaxy stellar mass relationship can be used. Combining stellar mass with the hurdle model’s insights into the M-σ relationship could provide an even more comprehensive understanding of the black hole–galaxy connection. Understanding this connection is critical to unraveling how black holes and galaxies co-evolve.

Original astrobite edited by Cole Meldorf.

About the author, Pranav Satheesh:

I am a graduate student in physics at the University of Florida. My research focuses on studying supermassive binary and triple black hole dynamics using cosmological simulations. In my free time, I love drawing, watching movies, cooking, and playing board games with my friends.

The post Jumping Through Hoops: A New Way to Explore the Black Hole–Galaxy Connection appeared first on AAS Nova.

❌