
❌

Normal view

Cluster Before Stack: A New Algorithm for Pulsar Timing

19 September 2025 at 17:00

A photograph of a large radio dish taken during the day from above.

To measure properties of a pulsar accurately, astronomers have to stack many individual observations together to boost the signal above the noise. But what if there was a more clever, more effective way to add observations than simple stacking?

Weak Cosmic Lighthouses

Pulsars, or rapidly spinning neutron stars that emit narrow cones of radio waves, are often referred to as the galaxy’s lighthouses. Just like a sailor looking to shore might see a periodic flash when a lighthouse’s beacon sweeps over their ship, so too would radio telescopes aimed at a pulsar detect a “pulse” when its beam sweeps across Earth. However, although this comparison to lighthouses is a powerful analogy, it starts to break down when considering the speed and strength of these flashes.
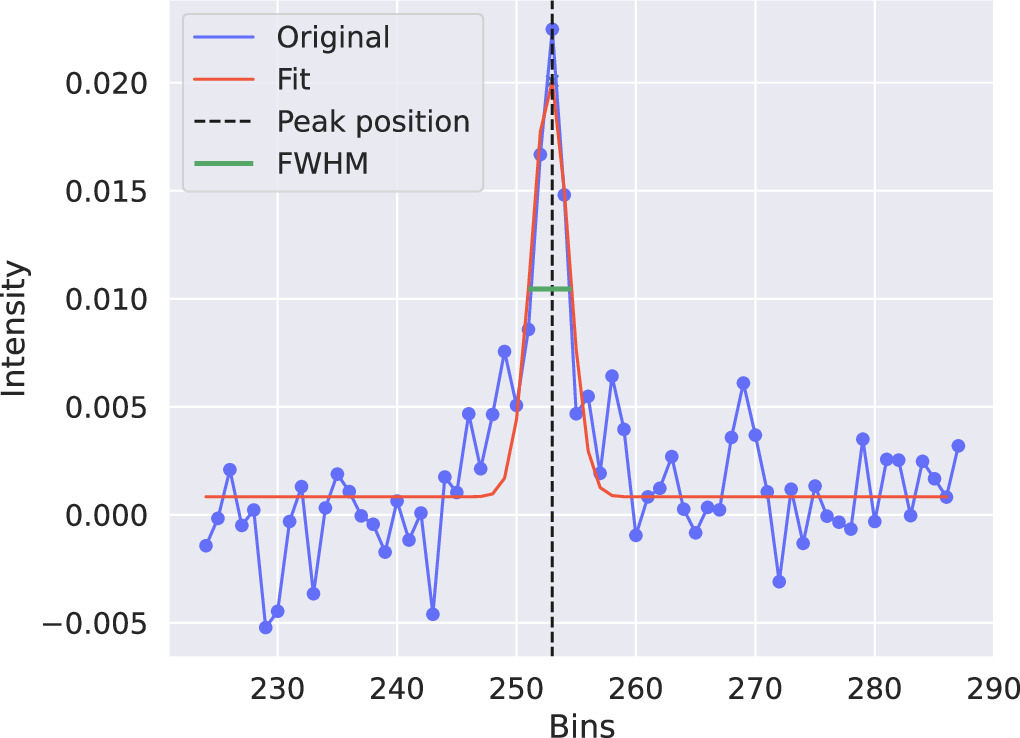
A time series showing a Gaussian-like spike.

An example of one noisy individual pulse. Click to enlarge. [Sosa Fiscella et al. 2025]

While lighthouses may take several seconds to rotate their lens and lamp once around, pulsars do the same in just a few milliseconds. What’s more, while lighthouses are designed to be bright enough that sailors can notice every individual flash, pulsars are comparatively dim. To confidently measure the “pulse profile,” or how a pulsar’s radio intensity changes as a function of its rotation phase, astronomers need to stack those hundreds of thousands of pulses together into one artificial super-bright pulse. Only then can they measure the quantities they care about, like the precise spin period and average pulse arrival time.

This practice rests of the subtle assertion that every individual pulse is just a noisy variation of the same unchanging pulse profile. But is that safe to assume? And can we improve the precision of our measurements by doing something more complex than simple stacking? These are the questions recently tackled by a team of astronomers led by Sofia V. Sosa Fiscella (Rochester Institute of Technology) in research published in The Astrophysical Journal.

Squeezing the Data

The researchers focused on one particularly bright source named PSR J2145−0750 that was observed by the Green Bank Telescope for two hours in 2017. This pulsar is so bright that it’s possible to measure quantities like the pulse width, height, center, and total energy of individual pulses, not just the final stack. The team did just that for each of the more than 200,000 pulses in their dataset and assigned each one a vector of four numbers. When they next sorted the pulses into distinct groups, they found that there were indeed correlations among these variables: for example, pulses with higher maximum heights tended to arrive earlier and be narrower than the overall average.
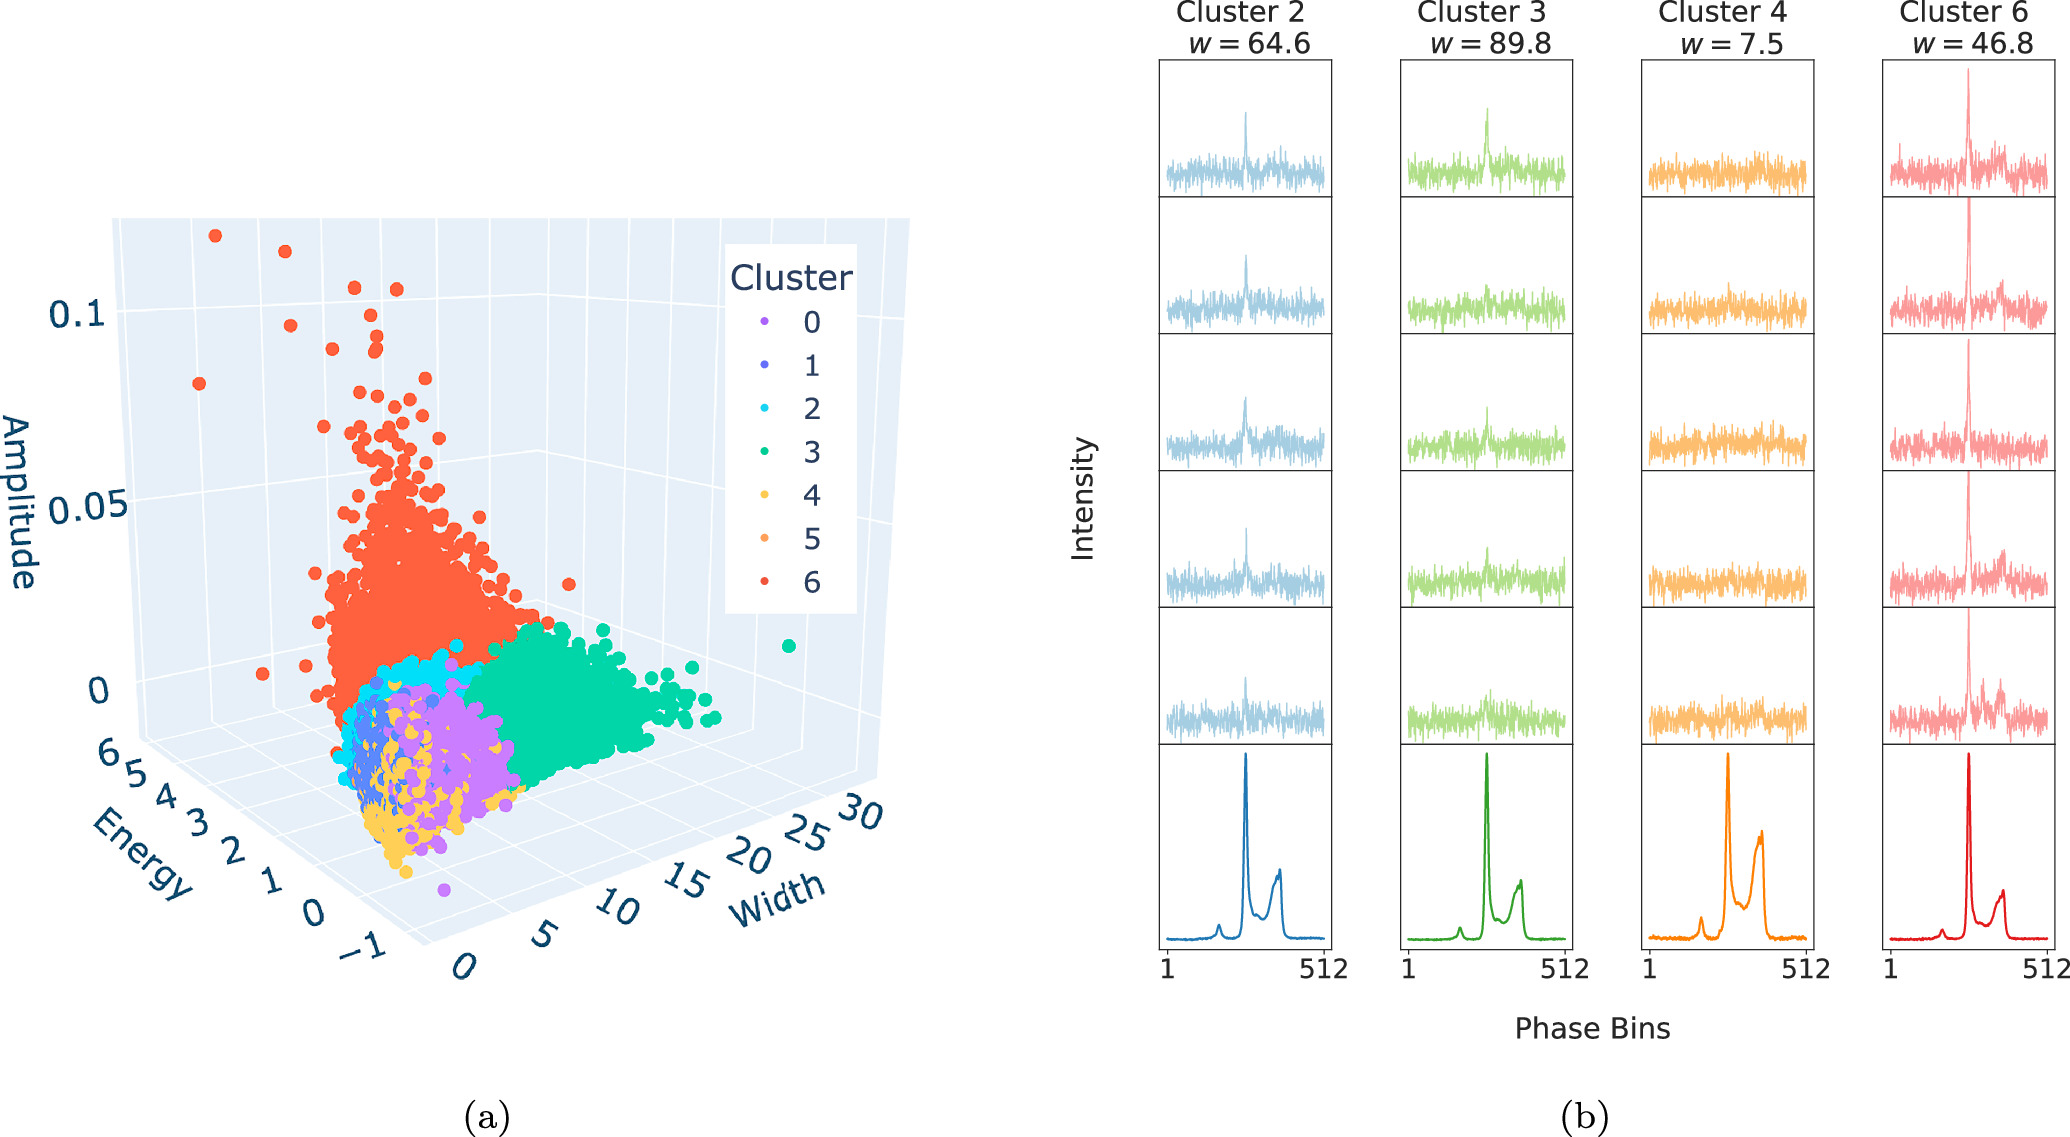
A 3D plot across different measured pulse characteristics where each point is colored according to its cluster.

A visual representation of the different pulse clusters. Each point corresponds to one pulse. Click to enlarge. [Sosa Fiscella et al. 2025]

To take advantage of this structure, they created a stacked pulse profile for each cluster, measured the center in each of them, then averaged all the cluster-specific times together into a final answer. While the standard method of stacking all of the data into one pulse profile resulted in a timing precision of 0.066 microsecond, this new method shrank the uncertainty to 0.057 microsecond, a meaningful improvement.

Though the team cautions that this new method will likely only be relevant for the pulsars for which we can measure individual pulses, they also point out that as better telescopes come online, we’ll be able to do that for more pulsars. In the meantime, astronomers can take comfort in the fact that as our technological abilities improve, so do our abilities to squeeze as much from our data as possible.

Citation

“Improving Pulsar Timing Precision with Single Pulse Fluence Clustering,” Sofia V. Sosa Fiscella et al 2025 ApJ 984 111. doi:10.3847/1538-4357/adc1c2

The post Cluster Before Stack: A New Algorithm for Pulsar Timing appeared first on AAS Nova.
Jumping Through Hoops: A New Way to Explore the Black Hole–Galaxy Connection

3 June 2025 at 17:00

composite image of the active galaxy Centaurus A

Editor’s Note: Astrobites is a graduate-student-run organization that digests astrophysical literature for undergraduate students. As part of the partnership between the AAS and astrobites, we occasionally repost astrobites content here at AAS Nova. We hope you enjoy this post from astrobites; the original can be viewed at astrobites.org.

Title: A Novel Approach to Understanding the Link Between Supermassive Black Holes and Host Galaxies
Authors: Gabriel Sasseville et al.
First Author’s Institutions: University of Montreal; Ciela—Montreal Institute for Astrophysical Data Analysis and Machine Learning; Center for Research in Astrophysics of Québec
Status: Published in ApJ

Most galaxies are thought to host a central supermassive black hole, and these black holes play a crucial role in shaping how galaxies evolve. There is a strong connection found between the properties of a galaxy and its central black hole. One of the most well-known examples is the relationship between the black hole’s mass and the random motions of stars near the galaxy’s center, measured by a quantity called stellar velocity dispersion (denoted as σ). This connection, known as the M–σ relationship, has been studied for decades and is often used to estimate the mass of a galaxy’s central black hole.

Interestingly, some galaxies appear to lack a central black hole. In many cases, observations only provide an upper limit on the possible mass of any black hole that might be there. In today’s article, the authors study the M–σ relationship with a new statistical approach to account for galaxies that might not have a central black hole and improve the calculation of this relationship.

Hurdle Up, the Bayesian Way

The authors use a statistical method called the Bayesian hurdle model. To update our understanding, Bayesian modeling combines prior beliefs or initial guesses with new evidence. The Bayesian hurdle model approach tackles two key questions: first, whether a galaxy is likely to host a central black hole, and second, if it does, how the black hole’s mass relates to the galaxy’s velocity dispersion (σ). The model works in two stages. In the first step, called the “hurdle,” a logistic regression determines the probability that a galaxy has a central black hole. If the galaxy clears this hurdle (i.e., is likely to host a black hole), the second step uses linear regression to establish the relationship between the black hole’s mass and the galaxy’s velocity dispersion, analyzed on a logarithmic scale.

The study examines a sample of 244 galaxies where either the central black hole mass has been measured directly or an upper limit has been estimated. From the logistic regression step, the authors find that galaxies with σ > 126 km/s have a 99% probability of hosting a central black hole. This result suggests that while massive galaxies are almost certain to have black holes, smaller dwarf galaxies are much less likely to host them.

A Steeper Correlation

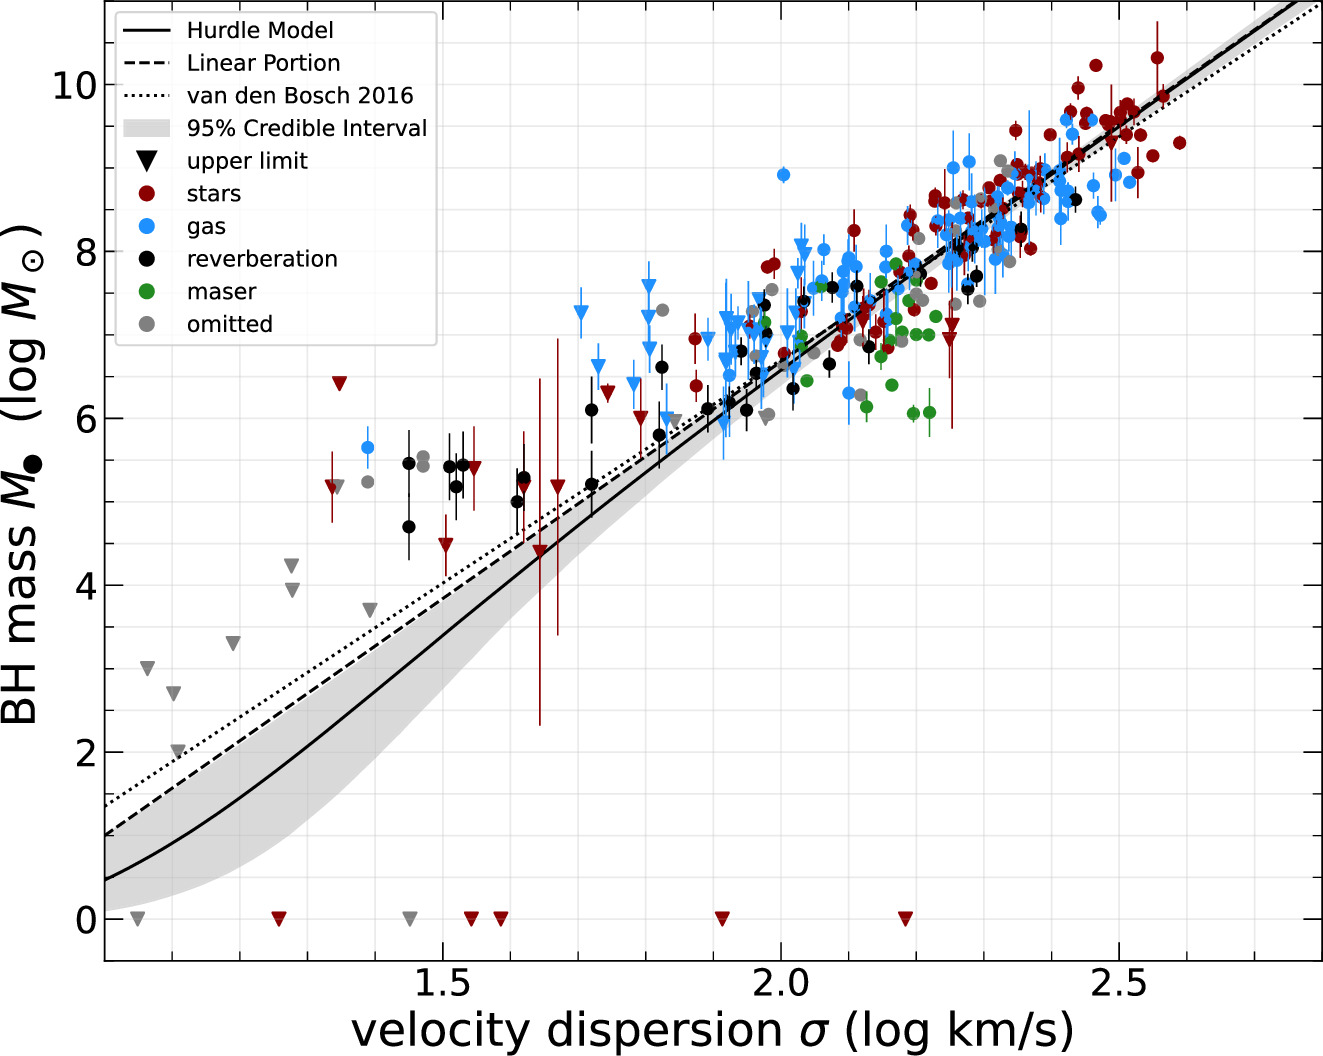
The hurdle model reveals a relationship of M ∝ σ5.8 between black hole mass and velocity dispersion, as shown in Figure 1 (solid black line). This result is steeper than the correlations found in previous studies. The difference likely arises from the authors’ inclusion of upper limits on black hole masses in their hurdle model analysis. The hurdle model also predicts several under-massive black holes in the range of 101–105 solar masses compared to other linear model studies. This downward shift in the lower mass range compared to other models is seen in Figure 1. Also, the breakpoint between under-massive and over-massive black holes occurs at a lower mass than previously reported. This shift is due to the hurdle model’s handling of upper limits in the logistic regression step, which pulls the curve downward.

plot of black hole mass versus velocity dispersion.

Figure 1: Relationship between the black hole mass and velocity dispersion (σ). The upper limits on the black hole masses are plotted in triangles while the circles indicate more precise measurements. The dotted black line shows the linear fit obtained in a previous study of this correlation. The hurdle model fit is shown as a solid black line while the dashed black line is the linear portion of the fit. Notice that the slope of the hurdle model fit (solid black line) is steeper than the fit from the previous study (dotted black line). [Sasseville et al. 2025]

The authors highlight that their model could benefit from better parameter estimates for the hurdle step, requiring further analysis of upper limits on black hole masses. They also recommend exploring alternative scaling relationships for calculating black hole masses. For example, the more well-established black hole mass–galaxy stellar mass relationship can be used. Combining stellar mass with the hurdle model’s insights into the M-σ relationship could provide an even more comprehensive understanding of the black hole–galaxy connection. Understanding this connection is critical to unraveling how black holes and galaxies co-evolve.

Original astrobite edited by Cole Meldorf.

About the author, Pranav Satheesh:

I am a graduate student in physics at the University of Florida. My research focuses on studying supermassive binary and triple black hole dynamics using cosmological simulations. In my free time, I love drawing, watching movies, cooking, and playing board games with my friends.

The post Jumping Through Hoops: A New Way to Explore the Black Hole–Galaxy Connection appeared first on AAS Nova.

❌